[page 127]
Appendices
A. The feasibility and pilot surveys
B. The sample design
C. Administration
D. Weighting and the calculation of standard errors
E. Withdrawal and replacement of schools and response rates
F. A comparison of the survey sample and national estimates
G. Methods of analysis
H. Definition of locality
I. Attainments in reading and mathematics (NFER)
J. The teaching of French
[page 128]
APPENDIX A THE FEASIBILITY AND PILOT SURVEYS
The feasibility survey
1 Following wide consultation throughout HM Inspectorate and under the direction of a central steering committee, schedules of questions for HMI survey teams, and questionnaires for teachers of classes to be inspected and heads of schools to be involved were prepared.
2 In November 1974 teams of two HMIs visited four schools, each of which contained 7, 9 and 11 year old teaching groups. In each school HMI inspected selected classes and jointly agreed their assessments. Teachers in the schools completed questionnaires.
3 In the light of this study the general method to be adopted was confirmed.
The pilot survey
4 In the Spring Term 1975 a full pilot study covering 56 schools was carried out. These schools were chosen to cover as wide a range as possible.
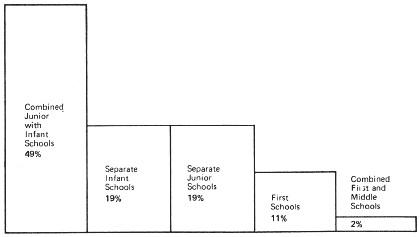
Table A1 The types of school covered in the pilot survey
| Category | Description |
| 1. | Urban; 3-form entry |
| 2. | Urban; 2- or 1-form entry |
| 3. | Suburban; 2-form entry |
| 4. | Suburban; 1 -form entry |
| 5. | Rural; number on roll 200 or more |
| 6. | Rural; number on roll 100 or less |
| 7. | Special features that might affect the arrangements to be adopted |
Note: Schools with open plan buildings, a handicapped class or nursery class were included in Category 7
5 As a result of the pilot and feasibility surveys alterations to administrative arrangements and questionnaires were made where appropriate. The survey design assumed a class teacher with responsibility for a class. For
[page 129]
the main survey the class teacher's questionnaire was restricted to questions which could be taken to describe the organisational context of a group of children of a particular age within the class. A question on social class which had a high refusal rate in the pilot survey was deleted. The staffing section of the heads' questionnaire was presented as a separate document and the HMI schedules were also carefully revised.
APPENDIX B THE SAMPLE DESIGN: A TECHNICAL ACCOUNT
Summary notes
6 The sample was drawn in three stages.
Stage 1: the first stage units were schools. These were stratified by HMI Division (8), organisational type (infant, junior, junior with infants, first and first with middle) and three size bands (>1, 2 and >3 form entry). For first and middle schools all schools of two form entry or larger were grouped together. In addition certain strata were empty. Total strata: 95. Stratification by form entry was approximate, using the number of 8, or in the case of infant schools, 7 year olds as a measure of size. Selection of schools was made with a probability proportional to form of entry (pps); this procedure yielded an overall sampling fraction of 2.6 per cent and a sample of 542 schools.
Stage 2: the second stage units were teaching groups. Within each of the 7, 9 and 11 year old age groups a teaching group was selected at random. Where there was only one teaching group selection was automatic.
Stage 3: this stage was carried out only for the purposes of administering the NFER tests. It applied to the 9 and 11 year old age groups only. The sampling units were individual children. Where a teaching group contained 21 or more children a systematic sample, with a 50 per cent sampling fraction, was taken. Where there were 20 or fewer in the teaching group all children were selected.
The sample of schools and teaching groups (Stages 1 and 2)
7 The survey design called for samples of 7, 9 and 11 year old teaching groups. Not all types of school in the survey included all of these age
[page 130]
groups (although self-evidently every school included at least one of the age groups). Where any of the specified age groups occurred in a school it was always included in the sample.
8 To draw these samples directly it would have been necessary to have details of the number of children of different ages in every individual class in maintained primary schools. The Department does not hold information in this detail and so the two stage sample was drawn.
Stratification
9 Before the first stage selection, schools were stratified according to HMI Division, organisational type and a 'measure of size' relating to the expected number of teaching groups per age group.
10 Stratification by HMI Division ensured an even geographical spread for the sample. Although the Inspectorate in England is centrally organised most inspectors are territorially based. For administrative purposes they were divided into 8 divisions (since reduced to 7). It was decided, as a general rule, to draw the HMI teams for sampled schools in a division from the divisional complement of inspectors; thus stratification by division was convenient administratively. Although the divisions vary considerably in the number of schools they cover, the divisional complements reflect this; thus the same sampling fraction could be used in each division without causing disproportionate survey work loads. However, to minimise any possible regional bias HMI also carried out inspections in divisions other than their own.
11 School organisation types are defined by the age range they cover. Thus the organisational type of a school dictated which of the three survey age groups would be present, see Table B1.
Table B1 The relationship between school organisational type and the survey age groups
| | School type
| Age groups | Infant | First | Junior | Junior with
infant | First and
middle |
| 7 | Yes | Yes | No | Yes | Yes |
| 9 | No | Possible | Yes | Yes | Yes |
| 11 | No | No | Yes | Yes | Yes |
[page 131]
12 Stratification by school type ensured that the sampling fraction was the same at each age group. The only difficulty was with first schools; some covered 9 year olds, some did not. The sample was drawn using lists relating to the position at January 1974. At this time there were 1,787 first schools of which 1,044 covered 9 year olds, ie 58 per cent of the total of all first schools. In the sample 61 per cent of first schools (28 out of 46), covered 9 year olds, so the sample accurately reflected the national picture.
Equal probability selection of teaching groups
13 The main focus of the survey was on teaching groups rather than schools. The sample design thus needed to yield an equal probability sample of teaching groups at each age. There were two possible ways of achieving this. Either one or all the teaching groups in each age group in each school could have been included in the survey. It was decided to employ the former approach since:
(a) this would allow the available manpower to cover the number of schools necessary, given the objectives of the survey,
(b) inspecting several groups across a number of schools would yield more statistically useful information than considering the same number of groups in one school,
(c) this would permit the teaching group sample sizes to be controlled and would allow the time needed to survey a school to be standardised, with consequent administrative benefits.
14 To achieve an exact equal probability sample of teaching groups it was necessary to know the numbers of teaching groups at each age in each school. As pointed out above (paragraph 8) such detailed information was not available. Therefore single age class organisation was assumed and the form entry (ie the number of classes per age group) was estimated using the number of 8 year olds (7 year olds in infant schools) as a measure of size.
[page 132]
Table 82 Stratification of schools into form entry strata using the number of 8 year olds as a measure of size
| Strata | Number of 8 year olds |
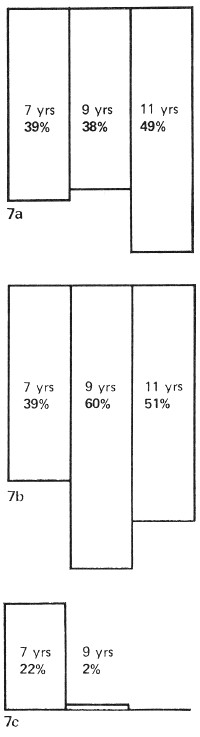
| One-form entry or less | 35 or less |
| Two-form entry | 36 to 80 |
| Three-form entry | 81 or more |
Note: A few schools in the three-form entry stratum had in excess of 120 8 year old children and were therefore probably four-form entry. There were too few such schools to justify another stratum.
7 or 8 year olds were used since they were in the middle of the primary age range. Appropriate arrangements for weighting, to adjust any imbalance caused by the use of a measure of size, are described in Appendix D.
15 Because of the small number of first and middle schools the 2- and 3-form entry strata for these schools were collapsed. The number of strata in the design was 112, (8 regions x 5 school types x 3 categories of form entry=120-8 due to collapsing of 2- and 3-form entry strata for middle schools; total 112). Several regions did not have first or first and middle schools; some did not have one form entry infant schools. This gave 17 empty strata so that the sample was actually covered by 95 strata. The number of schools in some of the strata, particularly in the stratum for one form entry schools, was small and where the sampling fraction did not yield an exact number of schools the last school selected for the sample was included or excluded on a probability basis. Because of this the number of schools in the one form entry stratum was slightly higher than expected (120 instead of 116).
Table 83 The design and actual sampling fraction for schools
| Schools | 1-form entry | 2-form entry | 3-form entry | All |
| Population number | 8,032 | 8,582 | 4,140 | 20,754 |
| Sample number | 120 | 245 | 177 | 542 |
| % Sample-actual | 1.49 | 2.86 | 4.28 | 2.61 |
| design | 1.43 | 2.86 | 4.29 | 2.58 |
16 Schools were sampled with a sampling fraction proportional to the form entry, so as to give an approximate, equal probability sample of
[page 133]
teaching groups at each of the three survey ages. The sampling fractions for schools are given in Table B3. The minor discrepancies apparent between actual and design percentages of the sample are due at one form entry to sampling error (discussed above); and at 3 form entry to rounding error.
17 The design sampling fraction for teaching groups was 1.43 per cent at each age group. The higher sampling fractions at 2- and 3-form entry are cancelled out by the larger number of teaching groups. The fact that some schools did not cover all three age groups did not affect this sampling fraction.
18 Because the stratification by a measure of size was approximate, it was possible that the effective sampling fractions at each age group would differ from the design figure. However, the effective sampling fractions were very close to the design fractions.
Table 84 The design and actual sampling fractions for teaching groups in percentages
| 7 year olds | 9 year olds | 11 year olds |
| Design | 1.43 | 1.43 | 1.43 |
| Actual | 1.20 | 1.26 | 1.23 |
The adjustment was calculated as follows:
[page 134]
Consider the 2-form entry stratum:
The same result holds for the 1- and 3-form entry strata, the effective sampling fractions being
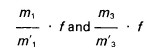
Adjusting for the differences in strata size gives the overall sampling fraction as
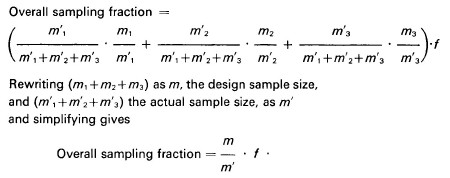
In other words, the actual sampling fraction is the design sampling fraction multiplied by the ratio of the design to the actual sample size.
Sampling for objective NFER tests (Stage 3)
19 Part of the survey involved giving objective tests to the children. These tests were supplied by the National Foundation for Educational Research (NFER), who also arranged their administration by teachers, and did preliminary analysis of the results. Tests were administered to 9 and 11 year old age groups (details are given in Appendix I).
20 In the main survey, tests were given towards the end of the summer term of the academic year in which the school was inspected. In order to establish satisfactory administrative procedures the tests were also given during the pilot survey at the time of HMI's visit.
[page 135]
21 A third stage in the sample was required because it was decided, in consultation with the Department of Education and Science, to use the test data as coming from a sample of individual children (see Appendix I). The third stage was drawn as follows: where a 9 or 11 year old teaching group inspected by HMI had fewer than 21 children they were all tested. Otherwise alternate children in the teaching group were tested, using the class register to take the sample. This reduced the variation in the number of children per teaching group tested (ie cluster size). It also avoided unnecessarily large samples. It was known that the sample design would tend to undersample teaching groups in vertically grouped schools. This would, of course, be corrected by reweighting (see Appendix D). However, these teaching groups in vertically grouped classes were liable to be small; the differential sampling of children introduced further weighting which tended to counterbalance the existing weights, thus moving the sample of children nearer to being a sample in which all children had an equal chance of appearing.
APPENDIX C ADMINISTRATION
22 It was decided that HM Inspectorate could provide sufficient manpower, within the context of their normal commitments, to inspect classes in about 540 schools in England over a period of five terms beginning in the Autumn Term 1975. This was judged sufficient, working on estimates of the likely sampling errors, to give a reasonable overall national picture, but it would not allow regional or other analyses requiring comparisons of small sub-divisions of the sample.
23 Before the start of each term a group of sample schools was nominated for inclusion in that term's programme. This group had approximately the correct proportion of schools from each division and as far as possible it reflected the characteristics of the full sample regarding the number of different types of schools. Thus the load in each division was roughly constant throughout the survey and the sample schools were covered in a balanced way. This allowed valid interim analyses to be carried out.
24 A programme of inspections for the term was organised for each division. The amount of time needed was fixed as shown in Table C1.
[page 136]
Table C1 Time allowed for inspection of schools according to type and size
| Type of school | Age group covered | Time (days) |
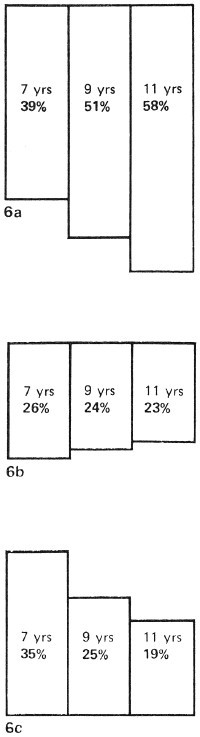
| Infant | 7 | 1½ |
| Small junior with infant | 7, 9 and 11 | 2 |
| 1 -form entry junior with infant | 7, 9 and 11 | 2½ |
| 2/3-form entry junior | 9 and 11 |
| 2/3-form junior with infant | 7, 9 and 11 | 3 |
Note: i. First schools were allocated between 1! and 2! days depending on their size and whether they contained 9 year olds.
ii. Combined first and middle schools were treated as junior with infant schools.
iii. In all cases t day was allowed additionally for discussion.
25 Local Education authorities were informed before the start of each term which of their schools would be affected. The head of each survey school was notified by letter of the coming visit a few weeks before it was due to take place. He or she was given the proposed date and requested to complete a table giving details of each class in the school. (The letter and table are reproduced in Annex A)
26 One member of each HMI survey team, termed the visiting inspector, was responsible for the conduct of the survey in each school. At least three weeks before the inspection was due to take place the visiting inspector paid a preliminary visit to the school to explain the purpose of the survey; the fact that schools would not be reported on individually was stressed.
27 A further purpose of the preliminary visit was to select the teaching groups to be involved in the survey. This was done as follows: the table completed by the head showed which of the three survey age groups were to be found in the school. Disregarding any special units or classes, any entries of 6 or more children in the 7, 9 or 11 year columns represented a survey teaching group (for circumstances in which groups of less than 6 children were acceptable, see Appendix F para 3). For each of the three age groups where there was only one teaching group this was automatically selected. Otherwise one teaching group was selected at random for each age group. One of the schedules provided for the survey team included an alphabet devised to assist randomisation. On one twenty-sixth of forms the alphabet started at A and went through to Z; on the next twenty-sixth it started at B and went through Z to end at A; and so on. Before distribution to survey teams the forms were shuffled, to ensure that they were used in random order. The classes of a given age group from which one
[page 137]
was to be selected for the purposes of the survey, were listed according to the alphabetical order of the surnames of their class teachers. The first name to appear alphabetically in the given alphabet on the HMI schedule indicated the class to be chosen.
28 The final purpose of the preliminary visit was to distribute and discuss the questionnaires to be completed by the head and the teachers from whose classes teaching groups had been selected for the purpose of the survey. The teachers concerned were asked to complete the forms and return them to the visiting inspector before the main survey visit. This enabled the visiting inspector to ensure that the forms were fully completed. (The three questionnaires are reproduced in Annex A)
29 If a student teacher was due to take a survey class at the time of the inspection it was left to the discretion of the head whether the student was replaced by the permanent class teacher for the duration of the survey. It was made clear that students, like teachers, were not being assessed. In fact it was very rare indeed for students not to be replaced. In all cases class teachers, not students, were required to fill in the class teacher's questionnaire.
30 Following the feasibility study at least one and often both of the pair of HMI inspecting classes for the main survey had had previous experience in the survey. Both HMI inspected each of the relevant classes and made agreed returns. The pairs of HMI were rearranged for each inspection. Although the majority of inspections carried out by an HMI were in schools in his or her home division, inspections in other parts of the country were also undertaken. The majority of HMI in the survey team had taught in primary schools and all had had experience of inspecting primary schools. Some subject specialists whose main teaching experience had been in secondary schools were brought into the survey team each term. These arrangements were made to reduce, as far as possible, the results of any individual bias.
31 The first analyses of returns were made by groups of HMI each containing at least one primary specialist and relevant subject specialists.
[page 138]
APPENDIX D WEIGHTING AND THE CALCULATION OF STANDARD ERRORS
Weighting
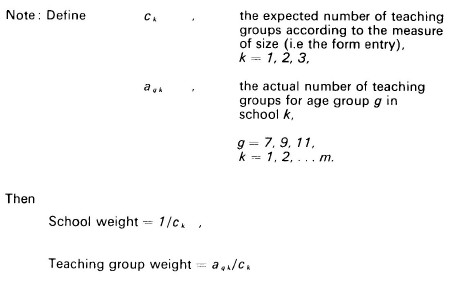
32 The estimates calculated from the sample were weighted to take account of difference in selection probabilities. In the case of schools the differences were part of the design; with teaching groups the differences arose when the number of teaching groups predicted by the measure of size was different from the number actually found.
33 The sampling fraction was defined in terms of schools. Therefore, for school-based estimates, the sample is self-weighting by region. However because the proportions of 1-, 2- and 3-form entry schools varied slightly between divisions the sampling fraction for teaching groups also varied marginally, lying between 1.41 and 1.51 per cent. In view of the evaluative nature of much of the HMI survey data, and the size of the sampling errors, these differences were of no consequence and, for simplicity, teaching group estimates were calculated on the assumption that the sample was self-weighting by region. The argument did not hold when calculating the estimates for objective test (NFER) survey data. The data were objective and accuracy was of paramount importance in view of the very small sampling errors. Therefore the divisional samples were weighted for the purposes of dealing with objective test (NFER) survey data.
[page 139]
Standard errors for HMI survey data
34 Weighting affects the calculation of standard errors. A slightly biased estimate of the variance of a proportion can be deduced as shown in the following note, ignoring the finite population correction.
Note: Take a sample, size n, from an infinite population.
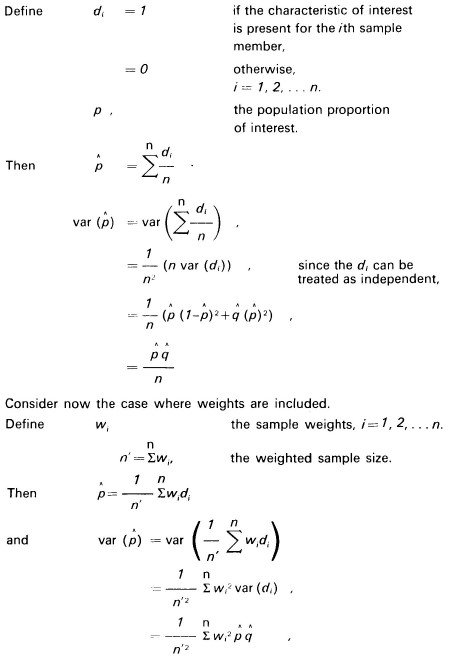
[page 140]
Thus the variance, taking account of the weights, has a factor

compared to the estimate using the weighted sample size but ignoring the weights.
Taking the case of weighted school-based estimates we have:
| Sample size = | n | = 540 | |
| n' | = 300 | |
| w1 | = 1 | 119 cases |
| | = 0.5 | 244 cases |
| | = 0.33 | 177 cases |
This gives a factor of 0.66. In other words, assuming an unweighted sample with sample size n' we overestimate the variance by a factor of 1.5. The standard error is overestimated by a factor of 1.2.
35 The actual design involved stratification, so that the estimate based on a simple random sample size n will actually be slightly more of an overestimate than indicated. The factor will vary when estimates are drawn from part of the sample. Therefore, for simplicity, all standard errors for school-based estimates were calculated assuming simple random sampling and reduced by an arbitrary 10 per cent; this procedure erred on the side of caution.
36 The 7 year olds required slightly more weighting and the 11 year olds slightly less than the 9 year olds. The percentage of groups with a weight of one was 57 and 68 per cent respectively. The variance estimate, treating the sample as if it were a simple random sample and using the weighted total, is 80 per cent of the weighted value for 9-year-old teaching groups. The standard error is 87 per cent. Thus, again using an arbitrary value, all standard errors for 7,9 and 11 year olds were increased by 10 per cent.
[page 141]
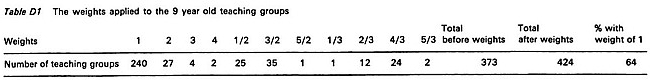
Table D1 The weights applied to the 9 year old teaching groups
 [click on the image for a larger version]
[page 142]
37 The calculation of standard errors for the child-based estimates presented in Chapter 6 iii (see Annex I for more details) was not straightforward. The sample design was three stage, with unequal and non-proportional selection probabilities for unequal size clusters (the teaching groups). The methods of calculating the standard errors for this sample design are not known and therefore simplifying assumptions had to be made.
38 The teaching groups were assumed to have come from a stratified random sample. This assumption is true for teaching groups in the one form entry stratum, but it ignores the school clustering in the 2- and 3-form entry strata. The assumption implies that two or more teaching groups of the same age could be selected from the same school. In fact, this could not happen but. even under the assumption, with a sampling fraction for groups of about one in 70 in the 2- and 3-form entry strata the chances of more than one teaching group of the same age being selected from a particular school are extremely slight. Therefore the assumption seems reasonable.
39 The design was thus reduced, under the assumption, to two stages. From Kendall and Stuart (1) it seemed that the second stage variation could be ignored. Of course where the whole teaching group was selected there was no second stage variance.
40 With these two assumptions, the design was reduced to a stratified random sample of unequal clusters with unequal and non-proportional selection probabilities. Even here an approximate method for the calculation of standard errors had to be employed.
41 Regardless of the approach to the calculation of the standard errors the mean had to be estimated by a ratio estimate, which is biased. The actual form of the estimate used did depend upon the assumptions made for the calculation of the standard errors. It can be shown that the bias of the mean is negligible and that the approximation for the standard errors is satisfactory. The formulae used are presented below. They are taken from Kish (2).
References:
1. Kendall and Stuart. The advanced theory of statistics Vol. 3 Section 39.46.
2. Kish L. Survey sampling John Wiley 1965 Chapter 6.
[page 143]
[page 144]
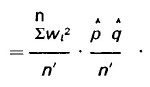
The ratio mean is of the form y/x, where. in our case, x is the sample size. The bias occurs because x is a random variable. We have

The correlation

is likely to be very small. Hence any bias in the ratio mean can be safely ignored. This agrees with the conclusion of Kish. He also demonstrates that with cx < 0.1 the bias in the variance estimate is likely to be between 3 and 6 per cent which is negligible. Clearly, with cx = 0.017, any bias can be safely ignored.
[page 145]
APPENDIX E WITHDRAWAL AND REPLACEMENT OF SCHOOLS AND RESPONSE RATES
Withdrawal and replacement of schools
42 When the original sample was drawn, at the first stage one or two extra schools were randomly selected in each stratum to provide replacements if any sample schools had to be withdrawn. A total of 21 schools were withdrawn and replaced. Reasons for which schools were withdrawn and replaced are given in Table E1.
Table E1 Reasons for which schools were withdrawn and replaced
| Reason for withdrawal | Number
of schools
withdrawn
& replaced |
| Closed subsequent to selection | 5 |
| Major change of type | 5 |
| Recently inspected or surveyed (including 2 schools from the national primary survey feasibility and pilot studies) | 6 |
| Serious illness of head teacher | 3 |
| Exceptional local circumstances | 2 |
43 The first two categories shown reflect the time lag between selection and the survey visit for many schools. The category 'major change of type' included change to a middle school (which took the school outside the survey coverage): the amalgamation of two schools (one of which was in the sample): or the splitting of a survey school into two separate schools.
44 A number of schools, although they changed type, were not withdrawn and replaced. The overall effect of such changes on the sample was small. This was because the main change from design to actual sample was due to the formation from infant schools of new first schools, and the majority of these did not cover the 9 year old age group by the time of the inspection.
Table E2 The design and actual sample of schools by type
| Infant | Junior | Junior
with
infant | First | First
with
middle | Total |
| Design sample | 146 | 141 | 202 | 46 | 7 | 542 |
| Actual sample | 136 | 136 | 202 | 59 | 9 | 542 |
[page 146]
Response rates
45 HMI survey data. HMI gathered data on all the 542 schools in the sample. Data for one school were lost in the post. Another school had such a flexible organisation that the categories of class teacher and teaching group did not apply. The survey data for this school did not accurately reflect the true situation and it was therefore excluded. Neither school was replaced. Both schools were junior with infant. The sample estimation procedures were adjusted to take account of the loss, which was too small to have any noticeable biasing effect. The response rates for data collected by HMI are shown in Table E3.
Table E3 The response rates for HMI survey data
| Schools | 7-year-old
teaching group | 9-year-old
teaching group | 11-year-old
teaching group |
| Design total | 542 | 406 | 376 | 347 |
| Actual total | 540 | 404 | 373 | 344 |
| % response | 99.6 | 99.5 | 99.2 | 99.1 |
Notes: 1. The design totals take account of the school type changes shown in Table E2.
2. The number of 9-year-old classes and the number of 11-year-old classes inspected were both one less than the design total because one junior with infant school, by chance, had no 9 year olds and one junior school had an age range of 7-10 years.
46 Objective test (NFER) survey data. All the schools involved in giving objective (NFER) tests supplied data. In three cases the BD and NS6 reading tests were accidentally reversed and given to the wrong age group. Data from these schools were excluded. Further, in some cases a few children of the wrong age were tested and they were also excluded.
Table E4 The response rates for objective test (NFER) survey data and reasons for which children were withdrawn
| Test | Age
group | Children
tested | Children withdrawn because: | % Response |
a. Error in
admin. of
tests | b. Wrong
age |
| BD Reading Test | 9 | 5289 | 46 | 78 | 97.7 |
| NS6 Reading Test | 11 | 5083 | 41 | 87 | 97.5 |
| E2 Mathematics Test | 11 | 5071 | - | 80 | 98.4 |
[page 147]
47 The incidence of unusable responses was too small to be of any significance. Estimates were made, when the sample was designed, of the likely sample sizes for these tests. No data on teaching group organisation were then available, so single age class organisation had to be assumed. This meant that the sample sizes were over-estimated. The estimates were 5,750 and 5,400 at 9 years and 11 years old respectively. The achieved sample sizes seem reasonable and are close enough to the estimates, which were known to be over-estimates, to suggest there was little likelihood that significant numbers of children who should have been tested were omitted, for whatever reason.
48 Summary of response rates for HMI and objective test (NFER) survey data. The two schools for which no data existed in the HMI survey data are included in the objective test (NFER) survey data: the three schools for which no data existed in the objective test (NFER) survey data are included in the HMI survey data.
Table E5 The design and actual sample of teaching groups in relation to the collection of HMI and objective test (NFER) survey data
| Design sample | Actual sample:
HMI survey data | Actual sample:
objective test
(NFER) survey data | Total
actual
sample |
| 7 yr | 406 | 404 | - | - |
| 9 yr | 376 | 373 | 372 | 370 |
| 11 yr | 347 | 344 | 343 | 341 |
See footnote 2 to Table E3
APPENDIX F A COMPARISON OF SURVEY SAMPLE AND NATIONAL ESTIMATES
49 By comparing survey sample estimates with other data it is possible to check whether the sample is truly representative or whether it is biased. The survey fieldwork was spread over five terms and inevitably during that time there were changes both in the population and the sample. Thus any comparison must be approximate.
50 Two comparisons were made. First, the survey sample and national distributions of schools by organisational type were compared. The stratification of schools by type was affected slightly by the factors
[page 148]
mentioned in the previous paragraph. However, the sample was found to reflect the national population very closely. The national figures were estimated using a weighted average with weights of 0.6 and 0.4, to take account of the fact that three-fifths of the sample schools were covered in the academic year 1975/76.
Table F1 A comparison of the national* and survey sample distribution of schools by type in percentage
| Type of school | Maintained schools in England
| Weighted
average for
the 2 years | Actual
sample
distribution | Difference
(sample-
average) |
January
1976 | January
1977 |
| Infant | 20.7 | 20.2 | 20.5 | 19.3 | (-1.2) |
| Junior | 19.1 | 18.8 | 19.0 | 19.3 | (+0.3) |
| JMI | 48.5 | 46.8 | 47.8 | 49.0 | (+1.2) |
| First | 10.2 | 12.3 | 11.0 | 10.5 | (-0.5) |
| First and middle | 1.5 | 1.8 | 1.6 | 2.0 | (+0.4) |
| Total | 100.0 | 100.0 | 100.0 | 100.0 | - |
*Source: Statistics of Education, Volume 1, 1976 and 1977, HMSO
51 The second check on the sample was to estimate the total number of children in each of the three survey age groups and to compare these estimates with the actual figures. The sample was not designed to give these estimates; they were only calculated for this check. In order to avoid observing extremely small groups of children, or even individuals, the minimum size for a teaching group was set at six children (except in the rare cases where the total number of children in an age group in any class was less than six). Thus the sample estimates of the number of children in each age group were biased upwards. (This bias does not, of course, affect the data given in the report.)
52 The numbers of children aged 6, 8 and 10 at 31 August 1975 and 31 August 1976 were used to estimate the actual national totals. As before a weighted average was formed.
53 The actual standard errors for the sample estimates would be difficult to calculate, but approximate calculations, taking account of the work carried out in relation to objective test (NFER) data, suggest that they were about 2 per cent of the total. Thus a 95 per cent confidence interval for each sample estimate was about ±4 per cent of the estimate. Taking account of the upward bias due to the definition of a teaching group, which is likely to
[page 149]
be small, and the marginal discrepancies shown in Table F1, the comparison in Table F2 indicates that the sample was otherwise representative. In fact. it can be concluded with some confidence that the sample was not biased in any way.
Table F2 The number of children in the 7, 9 and 11 year old age groups as estimated from the sample and calculated from published statistics (1)
| Age group | Numbers (1,000)
calculated from
official statistics | Sample estimates
(1,000) | % difference
(sample-official) |
| 7 year olds | 707.9 | 701.9 | (-0.8) |
| 9 year olds (2) | 672.5 | 690.2 | (+2.6) |
| 11 year olds (2) | 620.7 | 658.6 | (+6.1 ) |
1 Statistics of education, Volume 1 . 1976 and 1977
2 The 9 year and 11 year old figures exclude children in middle schools
APPENDIX G METHODS OF ANALYSIS
54 The calculation of standard errors for descriptive statistics has already been discussed in Appendix D.
55 This appendix describes how associations in the data were examined and includes examples of some analyses.
Hypothesis testing
56 Strict attention was paid to the logic of hypothesis testing. As far as possible hypotheses were generated without reference to the data. As is usual with a survey of this kind some hypotheses were generated as the analysis proceeded. In only a few cases, for example where differences between classes in different types, sizes and localities of school were examined, were the data systematically searched for 'significant' differences.
Significance testing
57 Significance testing was extensively used, but bearing in mind the way that hypotheses were constructed associations were not necessarily
[page 150]
excluded if they did not show significance. It should be noted that weighting of data affects significance tests, but the effects are not known.
58 Where the concern was only with establishing associations within the sample it was legitimate to use the data unweighted. Where the concern was to establish associations between population estimates weighting was necessary. For class-based data the weighted data were tested. It was assumed that weighting would not affect significance levels too much (see Appendix D for details of weighting) but even so the levels were used cautiously. For school-based data it was possible to compare unweighted data separately by the size of school as determined by forms of entry. Provided the pattern was the same for all three sizes the data were then amalgamated and handled unweighted for both sample and population associations. Otherwise reporting was done separately by size of school.
Techniques used
59 For nominal and ordinal data, analysis was by tabulation, using the chi-squared significance test.
60 For the test scores from the N FER, one-way analysis of variance was used with associated Tukey and Scheffé tests.
61 A difficulty with this analysis was that the mean scores were derived from samples of children of different sizes. The sample size ranged from 3 to 25, but 83 per cent of the samples fell inside the range 11 to 20 children.
62 The mean scores were analysed without weighting by the sample sizes since the majority of sample sizes were so close. The effect will be to make the analysis more sensitive to random fluctuations in the mean scores, hence the procedure was conservative.
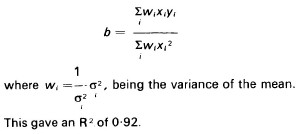
Reading Scores over time: weighted least squares regression
63 The formula used for this regression is given below. It was taken from Draper and Smith (1).
(1) Draper and Smith. Applied regression analysis. John Wiley & Son
[page 151]
An analysis of the partition of the sum of squares is given in Table G1.
Table G1 Analysis of partition of sum of squares for weighted regression
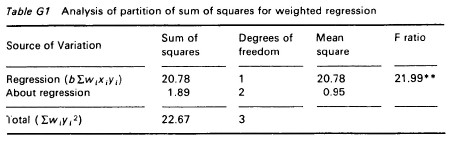
Clearly the regression does explain a very high proportion of the variance. An unweighted regression, which involves making the clearly unreasonable assumption that the four variances are equal, produced an R2 of only 0.75.
Widely taught items
64 In Chapter 5 there is a description of an analysis in which the proportion of classes undertaking a range of widely taught items was calculated. The items were considered in subject groupings, as combinations of subjects, and as a whole.
65 The data were searched and any item which occurred in 80 per cent or more of the classes in an age group was noted. In some cases, eg art and history, the requirement was that the class should be undertaking at least one item from a given range. This allowed for the greater, quite legitimate, diversity in these areas. For history and geography the 9-year-old classes did not quite meet the 80 per cent limit. (1) This was only important in that it affected the consistency of definition of the group of items. The percentages of classes undertaking the items (75 and 76 per cent respectively) were so near to 80 per cent that the discrepancy was considered unimportant.
(1) Chapter 6 i
[page 152]
66 Science does not feature because no item was undertaken by 80 per cent or more of classes at any age. Multiple choice items, as for history and art, were developed but the range of these items was so wide as to be meaningless.
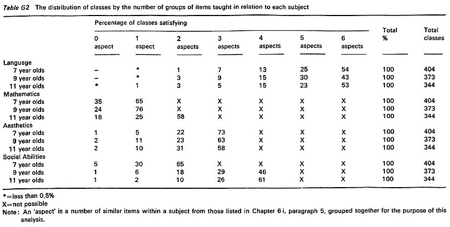
67 A calculation was made of the proportion of classes undertaking work relating to all the widely taught items in each subject. (1) As is to be expected, because of the larger number of items involved, the proportion of classes satisfying the group of language items is a little lower than the others. Again, to be able to interpret the results it is necessary to be sure that there were not a greater than expected number of classes which satisfied all but one aspect of the group of widely taught items. This indeed did not happen, see Table G2. For instance, for the items in mathematics at 11 years, by chance, we would expect to get percentages of 6, 30 and 53 compared to the actual percentages of 18, 25 and 58.
68 By chance, we would expect to have 18, 11 and 13 per cent of the 7, 9 and 11 year old classes undertaking work in relation to all items in each subject, assuming the groups of items in each subject were not associated.
69 The probability was calculated, under the hypothesis that the groups of widely taught items in each subject were not associated in any way, of obtaining the actually observed percentages of classes undertaking work relating to all items, namely 29, 19 and 24 per cent of 7, 9 and 11 year olds respectively.
70 The method used was (for 11 year olds) :
i. Probability of a class undertaking all widely taught items in all four subjects assuming independence
= 0.65 x 0.57 x 0.58 x 0.61
= 0.13
ii. Probability of 81 or more of the 344 classes undertaking all widely taught items in four subjects, assuming independence (ie 24 per cent or more) using the normal approximation to the binomial gives:
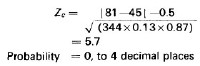
Probability = 0, to 4 decimal places
(1) See Annex to Chapter 6, Table 28
[page 153]
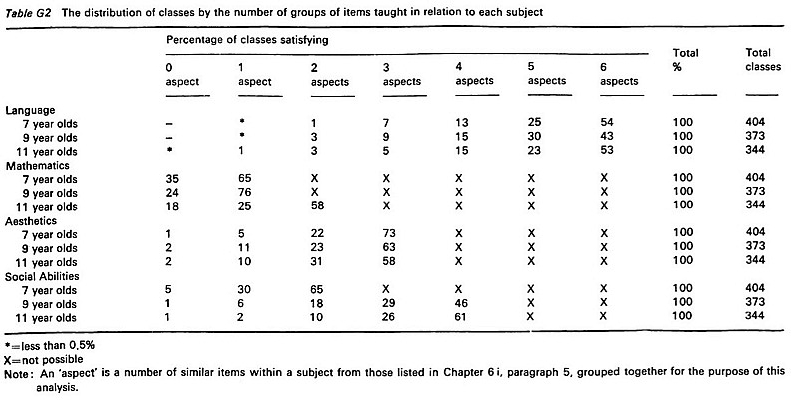
Table G2 The distribution of classes by the number of groups of items taught in relation to each subject
 [click on the image for a larger version]
[page 154]
The probabilities for 7 and 9 year old classes are also 0 to 4 decimal places. Obviously the model used is approximate, since it is assumed that all classes could undertake all items, whereas in practice the maximum figure would be 57 per cent. However, the approximation is clearly reasonable.
Match Assessments
71 In order to assess the overall match achieved by a class a 'match rating' was calculated To do this each of the 11 match questions was recoded as shown:
| Usual code | New code |
| Considerable over expectation | 5 | 1 |
| Slight over expectation | } reasonably | 4 | 2 |
| Good match | } satisfactory | 3 | 3 |
| Slight under expectation | } match | 2 | 2 |
| Considerable under expectation | 1 | 1 |
72 This recoding was done separately for each ability group. Adding the recoded match questions makes sense, since the higher the code the better the match. In practice virtually no over expectation was recorded, so a low match rating almost always implies under-expectation.
[page 155]
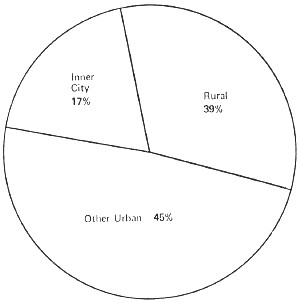
APPENDIX H DEFINITION OF LOCALITY
73 The sample was not stratified by locality because no definitions of particular schools by locality could reliably be made prior to HMI visits. HM Inspectors defined schools by locality at the time of the inspection; this information was subsequently employed in the analysis of the findings.
74 The following definitions were used:
| Inner city: | the centre of large conurbations and the inner rings of large cities. |
| Rural: | hamlets, villages and small towns with a population of 1 5,000 or less. |
| 'Other urban': | any area not able to be categorised as inner city or rural, including towns with populations exceeding 15,000 and certain parts of cities and conurbations. |
APPENDIX I ATTAINMENTS IN READING AND MATHEMATICS (NFER)
75 In parallel with the national primary survey carried out by HMI the Department of Education and Science contracted the National Foundation for Educational Research (NFER) to administer and to conduct preliminary analyses of the results of objective tests in reading and mathematics; these are considered here. This information is referred to as the NFER data, although the further analyses and interpretation of the data and the conclusions reached are the responsibility of the Department. The data are intended to contribute to a balanced view of work in primary schools. They also constitute, in part, the latest stage of the national survey of standards in reading at 11 years. The overall results of these tests will not be fully comparable with the results of the Assessment of Performance Unit's
[page 156]
monitoring programme from 1978 onwards. However, it should be possible to establish some links between scores from the tests and those from APU monitoring of performance in reading and mathematics at age 11 years.
i. THE PUPIL SAMPLE
76 The children who were tested were drawn at random from the 9 year and 11 year old teaching groups surveyed by HMI. The mathematics test used was derived from items suitable for 11 year olds produced in the Tests of Attainment in Mathematics in Schools Project. The selection of pupils from within the teaching groups, rather than from the whole year group within each school, was necessary to ensure that the data could be related to HMI's assessments, which were made in terms of teaching groups. The results presented in this chapter are, however, representative of all 9 year olds and all 11 year olds in primary schools in England.
77 The data were analysed in terms of performance of individual pupils. Where a teaching group contained 20 children or fewer the test was given to every pupil; otherwise every second child was tested. This procedure avoided testing an unnecessarily large sample and offered some statistical advantages (see Appendix G). Average scores for all pupils tested in each teaching group were also calculated, so that N FER scores and HMI assessments could be directly related (see Chapter 7).
78 The selection of children from teaching groups, although essential for this survey, provided a possible source of error because the national primary survey excluded children in permanent classes with a special function, for example, full time remedial classes. However, it was estimated on the basis of the class organisation tables completed by heads that only 0.5 per cent of children were in such classes. Even if they had been tested and every child had scored zero the overall national mean scores would have been depressed by only minimal amounts: for example in the case of the 11 year old reading scores by 0.2. The possible effect is so small that it can safely be ignored.
79 A second possible source of bias concerns streaming. If too many high or low stream classes had been included in the survey, the ability of the sample children would not accurately have reflected the national level of ability. The greatest care was taken to ensure that selection of teaching groups was random. Streaming occurred in only 12 of the 9 year old teach-
[page 157]
ing groups and 13 of the 11 year old teaching groups and there was a mixture of high and low stream classes in each case; it is therefore unlikely to have been a major factor. Nevertheless to test for bias arising from streaming the test results were recalculated, excluding all children in streamed classes, and there was no significant change in the national mean scores. For instance the mean score of the NS6 reading test was reduced by 0.15. The influence of streaming on the sample can confidently be discounted.
80 In order to ensure that administrative procedures were effective a selection of test materials was used alongside the HMI pilot survey in the spring term 1975.
81 The complete tests were given to approximately equal numbers of children in June 1976 and June 1977, in each case to children in the groups inspected during that particular academic year but not at the time of the inspection visits.
ii. THE TESTS
Reading Test NS6 (National Survey Form Six)
82 This test was used to assess the reading performance of 11 year olds. It is of the sentence completion type, in which the child has to choose the appropriate missing word from a given selection, and in which items are progressively more difficult. It was decided for a number of reasons that the NS6 was the appropriate test to use. The Bullock Report (1975) recommended that, pending the introduction of a new national monitoring system, currently being developed by the Assessment of Performance Unit of the Department of Education and Science, 'The NS6 (reading) test should remain in operation'. (1) NS6 was used in earlier surveys of reading standards carried out in 1955, 1960 and 1970, and so, since the surveys were similarly designed, direct comparison is possible between present and previous findings. In all, the test contains 60 items. It has consistently been shown to have a very high degree of reliability (0.95). It was suggested in the 1970/1 report (2) that two items in the test had become more difficult for children because they contain words which have become outdated. How-
(1) A language for life. Para 3.8 HMSO 1975.
(2) The trend of reading standards. K B Start and B K Wells. NFER 1972
[page 158]
ever, subsequent to the 1970 survey, unpublished research carried out by NFER showed that the items in question retained the same 'facility value' as before and that they were reasonably correctly positioned within the test. Results of the present survey support these findings.
Reading Test BD
83 Like NS6 this is a traditional, norm referenced test and was devised by NFER. The test contains 44 items. It was used to assess the reading performance of 9 year olds. Since reading standards at 9 years of age had not previously been monitored nationally the matter of comparability did not arise. BD was chosen because it was reliable and suitable for the age range in question; further, it was standardised relatively recently in 1969.
Mathematics Test E2
84 This test was used to assess the mathematical performance of 11 year olds. Since mathematical standards at 11 years of age had not previously been measured nationally it was not possible to select a test comparable with others used earlier for similar purposes. E2 was specially compiled for the survey from test items constructed by NFER in connection with the Tests of Attainment in Mathematics in Schools project (1); they were chosen as being suitable for 11 year olds. The test could be employed in future surveys to make comparisons of standards. The test comprises five sets of items; geometry, graphical representations, handling everyday situations, properties of whole numbers and a group of eight items covering additional aspects of mathematics. A total raw score has been calculated based on all 50 items.
iii. QUALITY OF DATA AND COMPARISONS WITH PREVIOUS SURVEYS
Level of response
85 In any survey the response rate has an important influence on the
(1) Similar test material is being used in the work undertaken for the DES Assessment of Performance Unit
[page 159]
quality of the data. The higher the response rate, the more reliable is the information which is obtained. In the present survey all schools initially responded; but owing to errors in school administration the data from three schools had to be excluded, thus the response level was 99 per cent. This is an exceptionally high rate of response.
Age correction
86 Age adjustments have been made to all the NFER data so that all scores relate to a fixed age chosen as the mean age of the sample. The advantage of this is that it allows valid comparisons to be made between groups or individuals within the sample. If age adjustments were not made, older children would have an advantage over younger ones in any comparison since it is well established that in the primary age range test performance is directly associated with age.
87 Samples from different surveys tend to have different mean ages. Accordingly, in order to make comparisons over time, it is sometimes necessary to restandardise some data at an age other than the sample mean. In this report, though the changes were small, the survey data have been restandardised as necessary to ensure that valid comparisons can be made with past data. The ages to which test results have been standardised are shown alongside the test results tables.
Standard errors
88 Mean scores are presented in the tables accompanied by their standard errors; these indicate the limits within which the sample means are likely to have deviated from the means which would have been obtained if the whole population had been tested. The larger the standard errors, the less statistically precise the results. If the standard error is multiplied by 1.96 a 95 per cent confidence interval is obtained. That is to say, if the survey was repeated many times, on average in 19 times out of 20 the confidence interval surrounding the sample mean would include the true, fixed mean of the whole population to whom the test might have been given.
Comparisons with previous surveys
89 Before any comparisons can be made with the results of previous surveys using Reading Test NS6, the quality of the data from all of the
[page 160]
surveys has to be considered. In each survey random sampling was used. The information used here about the earlier surveys is based on The trend of reading standards (Start and Wells, NFER, 1972). There seemed to be no difficulty in comparing the 1960 and 1976/7 results. Certain factors have to be taken into account before comparing the 1976/7 results with those obtained in 1955 and 1970.
90 The 1955 sample was drawn at random to be representative of Wales as well as of England. The way in which the survey was designed does not permit sample estimates for England only to be abstracted. However, in 1960 reliable parallel national surveys of Wales and England were carried out for 11 year olds; no significant differences were found between the performance of the Welsh and English children. It is therefore reasonable to assume, particularly since the 1955 school population of Wales was about one-fifteenth of that of England, that the inclusion of Wales in the earlier survey did not significantly bias the result.
91 One difficulty regarding the 1970 survey lies in the low response rate, which was 73 per cent. One in four schools did not provide data partly because of a postal strike, and partly for other undetermined reasons. If the schools which did not provide data were different in any way from those which did take part, the test results would have been biased. The size and direction of the distortion, if it exists, cannot be measured. Particular caution also has to be exercised in using the mean score of the 1970 survey because of the large standard error attached to it.
92 In order to establish the trend in reading standards since 1955, the findings of the four surveys were compared, see Table 11. In the present survey 4,955 children, age corrected to 11 years 2 months, took the NS6 test in 343 schools. A mean score for all pupils of 31.13 out of a possible 60 with a standard error of 0.33 was obtained.
93 Middle schools, deemed primary, were not in existence in 1960, and there were only 21 such schools by 1970. The 1976/7 survey did not cover middle, deemed primary, schools and therefore its coverage is slightly different from that of the earlier surveys. However, there is no reason to suppose the performance of 9 and 11 year olds in middle schools would be different from that of children of the same age in other types of primary schools. Moreover, there were only 1,153 middle schools out of a total of 21,371 primary schools in January 1976. Thus the exclusion of these schools in the 1976/7 survey would not be likely to affect the comparisons made.
[page 161]
iv. PRESENT STANDARDS AND TRENDS
Reading standards of 11 year olds
Table I1 NS6 Reading Test results from national surveys of samples of pupils in primary schools in England age corrected to 11 years 2 months. (See Graph 1)
| Date of survey |
| 1955(1) | 1960 | 1970 | 1976/1977 |
| Mean score | 28.71 | 29.48 | 29.38 | 31.13 |
| Standard error | 0.55 | 0.52 | 0.92 | 0.33 |
| Number of schools covered | na | na | 69 | 343 |
| Number of children tested | na | na | 1470 | 4955 |
| Response rate (%) | na | na | 73 | 99 |
na: not available. Special schools excluded.
(1) This survey covered England and Wales. An under-estimate of the England only mean in the region of 0.06 is possible.
There is a total of 60 items in this test.
Graph 1. NS6 Reading Test: Mean scores from national surveys with 95% confidence intervals mean age: 11 years 2 months

[page 162]
94 It can be said with confidence that the data from the four surveys were consistent with a rising trend in reading standards between 1955 and 1976/77. (See Graph 2, NS6 reading test; mean scores for national surveys.)
Graph 2. NS6 Reading Test: Mean Score for National Surveys. Mean age: 11 years 2 months.
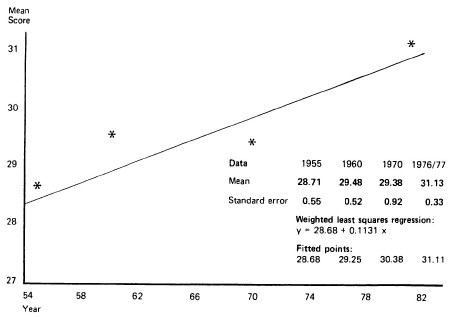
Note: It would be unwise to extrapolate the indicated trend line into the future. It is always necessary to be cautious when extrapolating trends from existing data. In this case the trend is meant as a general indication of the movement of reading scores. With only four points it is not possible to be sure that the trend line indicates detailed movements. If NS6 is used in future there is a special factor known as the ceiling effect which may lead to the true rate of any rise being under-estimated; in the present survey some of the ablest children achieved nearly maximum scores. This problem is discussed in A language for life (HMSO 1975), paragraphs 2.31 to 2.34.
[page 163]
Reading standards of 9 year olds
Table I2 BD Reading Test. Mean score for a sample of pupils in primary schools in England age corrected to 9 years 2.6 months
Number of
schools involved | Number of
children tested | Mean
score | Standard
error |
| 372 | 5,165 | 20.13 | 0.24 |
There is a total of 44 items in this test
95 Five thousand one hundred and sixty-five children (age corrected to 9 years and 2.6 months) in 372 schools took the BD reading test. A mean score was obtained of 20.13, with a standard error of 0.24.
96 Since this test had not previously been given to a nationally representative sample of 9 year olds, comparison with previous standards cannot be made.
Standards in mathematics of 11 year olds
Table I3 E2 Mathematics Test. Mean scores for a sample of pupils in primary schools, age corrected to 11 years 2.5 months
Number of
schools involved | Number of
children tested | Mean
Raw score | Standard
error |
| 346 | 4,991 | 27.97 | 0.30 |
97 A total of 4,991 children (age corrected to 11 years and 2.5 months) in 346 schools took the E2 mathematics test. A mean total raw score was obtained of 27.97 with a standard error of 0.30. Some comments on the educational implications of the results are made in Chapter 6 iii, paragraphs 29 to 32. Examples of the items used are given at the end of this appendix.
[page 164]
v. DIFFERENCES BETWEEN BOYS AND GIRLS
Table I4 NS6 Reading Test. Mean scores for a sample of boys and girls in primary schools in England, age corrected to 11 years 2.5 months
| Number of
schools involved | Number of
children tested | Mean
score | Standard
error |
| Boys | 341 | 2493 | 31.55 | 0.39 |
| Girls | 339 | 2462 | 31.10 | 0.36 |
| All pupils | 343 | 4955 | 31.32 | 0.33 |
Note: In this table the corrected age used is the mean age for the sample
There is a total of 60 items in this test
98 It can be seen from the standard errors associated with each mean that the difference was not statistically significant.
Table I5 NS6 Reading Test. Percentile distribution for boys and girls and all pupils at age 11 years 2.5 months
Possible range of scores 0-60
| Percentile | Boys' score | Girls' score | Boys' score minus
girls' score | All pupils |
| 90 | 47.0 | 45.8 | (+1.2) | 46.3 |
| 80 | 42.4 | 41.6 | (+0.8) | 42.1 |
| 70 | 38.8 | 37.9 | (+0.9) | 38.4 |
| 60 | 35.3 | 34.7 | (+0.6) | 35.0 |
| 50 | 32.4 | 31.0 | (+0.5) | 32.2 |
| 40 | 29.0 | 28.4 | (+0.5) | 28.8 |
| 30 | 25.0 | 24.2 | (+0.8) | 24.6 |
| 20 | 20.4 | 20.3 | (+0.1) | 20.3 |
| 10 | 14.3 | 15.0 | (-0.7) | 14.6 |
99 The percentile figures in the table may be interpreted as follows: the percentile of 90 indicates that 90 per cent of the boys scored 47.0 or less and 10 per cent scored more; the percentile of 20 indicates that 20 per cent of boys scored 20.4 or less and 80 per cent scored more.
Table I6 BD Reading Test. Mean scores for a sample of boys and girls in primary schools in England, age corrected to 9 years 2.6 months
| Number of
schools involved | Number of
children tested | Mean
score | Standard
error |
| Boys | 370 | 2610 | 19.56 | 0.29 |
| Girls | 366 | 2555 | 20.72 | 0.28 |
| All pupils | 372 | 5165 | 20.13 | 0.24 |
[page 165]
Table I7 BD Reading Test. Percentile distribution for boys, girls and all pupils age corrected to 9 years 2.6 months
Possible range of scores 0-44
| Percentile | Boys' score | Girls' score | Boys' performance
compared with girls | All
pupils |
| 90 | 32.9 | 32.5 | (+0.4) | 32.7 |
| 80 | 28.5 | 28.6 | (-0.1) | 28.5 |
| 70 | 25.0 | 25.6 | (-0.6) | 25.2 |
| 60 | 21.9 | 23.0 | (-1.1) | 22.5 |
| 50 | 19.2 | 20.7 | (-1.5) | 20.0 |
| 40 | 16.6 | 18.5 | (-1.9) | 17.5 |
| 30 | 13.5 | 15.4 | (-1.9) | 14.4 |
| 20 | 10.6 | 12.6 | (-2.0) | 11.5 |
| 10 | 7.2 | 8.9 | (-1.7) | 8.0 |
See paragraph 99 of this appendix for an interpretation of this table
100 The girls obtained a higher mean score in reading test aD than the boys; this difference is statistically significant, although, for practical purposes, very slight. It is of interest that despite the overall lower scores of boys the top 10 per cent of boys marginally outscored the top 10 per cent of girls.
Table I8 E2 Mathematics Test. Mean scores for a sample of boys and girls in primary schools in England, age corrected to 11 years 2.5 months
| MEAN | Number of
schools involved | Number of
children tested | Mean
raw score | Standard
error |
| Boys | 345 | 2515 | 28.30 | 0.35 |
| Girls | 343 | 2476 | 27.64 | 0.32 |
| All pupils | 346 | 4991 | 27.97 | 0.30 |
There are 50 items in this test
[page 166]
Table I9 E2 Mathematics Test. Total raw score. Percentile distribution for boys, girls and all pupils, age corrected to 11 years 2.5 months
Possible range of scores 0-50
| Percentile | Boys' score | Girls' score | Boys' score
minus girls' score | All
pupils |
| 90 | 41.8 | 40.2 | (+1.6) | 41.0 |
| 80 | 37.8 | 36.5 | (+1.3) | 37.1 |
| 70 | 34.4 | 33.3 | (+1.1) | 33.9 |
| 60 | 31.5 | 30.5 | (+1.0) | 31.0 |
| 50 | 28.4 | 27.9 | (+0.5) | 28.2 |
| 40 | 25.6 | 25.1 | (+0.5) | 25.4 |
| 30 | 22.9 | 22.4 | (+0.5) | 22.7 |
| 20 | 19.4 | 19.3 | (+0.1) | 19.3 |
| 10 | 14.6 | 14.8 | (-0.2) | 14.7 |
See paragraph 99 for an interpretation of this table
101 It can be seen that as the level of scoring increases the slight superiority of boys over girls also increases. There was no statistically significant difference in the total scores achieved by boys and girls.
vi. MATHEMATICS TEST E2
102 Most of the items used in this test are to be included in future surveys and so cannot be made public. Those reproduced on pp 167 to 171 have been chosen to indicate the range of items. They include some on which children scored well and others that many found too difficult. The percentage of children getting each item right is shown to the right of the test. The children were generally allowed 45 minutes to complete the test, but longer if they were still making progress through it.
[page 167]
[page 168]
[page 169]
[page 170]
[page 171]

[page 172]
Table I10 E2 Mathematics Test. Percentage of children answering each item correctly
Item
number | Percentage of
correct answers | | Item
number | Percentage of
correct answers |
| 1 (Aa) | 94 | | 26 (K) | 40 |
| 2 (Ab) | 84 | | 27 (F) | 64 |
| 3 | 87 | | 28 | 60 |
| 4 | 96 | | 29 | 76 |
| 5 | 92 | | 30 | 49 |
| 6 | 82 | | 31 | 18 |
| 7 | 86 | | 32 | 62 |
| 8 (C) | 92 | | 33 | 55 |
| 9 | 78 | | 34 | 60 |
| 10 | 72 | | 35 | 54 |
| 11 | 80 | | 36 | 52 |
| 12 | 86 | | 37 | 42 |
| 13 | 15 | | 38 | 23 |
| 14 (B) | 83 | | 39 | 42 |
| 15 (D) | 59 | | 40 | 84 |
| 16 | 57 | | 41 | 37 |
| 17 (E) | 47 | | 42 (G) | 37 |
| 18 | 41 | | 43 | 17 |
| 19 (J) | 69 | | 44 | 30 |
| 20 (N) | 76 | | 45 (M) | 28 |
| 21 (L) | 49 | | 46 | 35 |
| 22 | 45 | | 47 | 20 |
| 23 | 71 | | 48 | 27 |
| 24 | 31 | | 49 | 19 |
| 25 (I) | 61 | | 50 (H) | 20 |
Note: The letters shown after fourteen of the item numbers correspond to the test items reproduced in Appendix I
APPENDIX J. THE TEACHING OF FRENCH
103 As was explained in the preface, the teaching of French was not given high priority in the survey because a substantial report (1) has recently been published on the subject.
104 The sample of schools in this survey does not include any where French was taught to 7 year old children.
105 At 9 years of age 7 per cent of the classes taught French. Of these classes two-thirds were in separate junior schools. Only one class was in an inner city area, three were in rural areas and the remainder, 27, were in 'other urban' areas.
(1) Dr Clare Burstall. Primary French in the balance. NFER, 1974
[page 173]
106 French was taught in 25 per cent of 11 year old classes overall. In 'other urban' areas French was taught to 36 per cent of the 11 year old classes and in inner city areas to 9 per cent.
107 For the teaching of French to be effective in primary schools it has been suggested that it should be taught daily for at least 20 to 30 minutes, thereby totalling between 1hr 40 mins and 2 hours 30 mins each week. This was done in about a quarter of the classes that taught French; the remaining classes gave less than 1hr 40 mins a week to the subject.
[pages 174-205]
Annex A (pdf file)
[page 206]
Annex B HMI schedules
1 For the purpose of this survey HM Inspectors made their assessments in accordance with agreed schedules. These schedules listed a wide range of activities likely to be found in primary schools, so that a record of what was done in a variety of individual classes could be made and in order that the material could subsequently be dealt with statistically. The schedules were the same for all 7, 9 and 11 year old classes and regardless of the special circumstances of the school. It was not expected that any individual class would undertake activities relating to all the items listed in the schedules but that teachers make a selection from these according to the age and abilities of the pupils and the particular circumstances of the school. Six schedules were used, covering the following aspects of the work and organisation:
a. aesthetic education, including art and crafts, music and physical education
b. language and literacy
c. mathematics
d. experimental and observational science
e. social abilities, including history, geography and religious education
f. the organisation and methods of working including some aspects of the general provision in the school which influenced children's work.
Scales and 'match' assessments
2 To enable HMI's assessments and observations to be quantified, a number of scales were used. The following are examples of these scales.
[page 207]
i. The extent to which children made use of book collections or libraries as a starting point or resource to develop and extend language, whether spoken, written or through reading was recorded on a scale which referred to over-use; an appropriate level of use; under-use; no evidence of use; not used.
ii. The quality of book collections or libraries was assessed as good; generally good but some poor areas; generally poor but some good areas; poor; or no evidence.
iii. The emphasis given to practical activities involving addition, subtraction, multiplication and division was recorded on a scale which referred to overemphasis; appropriate level of emphasis; underemphasis; no evidence; not given attention.
iv. The extent to which opportunities were taken to develop singing as an aspect of musical experience was recorded as taking place to a significant degree; to an insignificant degree; no evidence; or not given attention.
3 In assessing emphasis or significance HMI based their judgement on what experience has shown to be reasonable for children of a given age and ability. For example, in assessing whether opportunities were taken to develop gymnastics, dance, games or swimming to a significant degree, HMI took into account not only the age of the children and the time devoted to these activities but also other indicators such as the available resources, the pace of the work and the pupils' involvement and application.
4 The degree of 'match' between the standard of work the children were doing and that which they were considered by HMI to be capable of doing, as judged by their performance at the time of the inspection, was recorded in the following categories:
| Considerable over-expectation | | |
| slight over-expectation | } | reasonably satisfactory match |
| good match | } |
| slight under-expectation | } |
| considerable under-expectation | | |
5 HM Inspectors made their assessment on the basis of the observation of the work in progress, the inspection of previously completed work including the work in children's exercise books, discussions with teachers
[page 208]
and talking with children. The assessments were made separately for the more able, average and less able groups of children within each class as identified by their teachers.
6 Over-expectation was evident where children made too many mistakes and appeared to lack confidence; the level of the work was too difficult for the children and was remote from their previous experience and existing skills and knowledge; tasks set were beyond the understanding of the children and called for the mastery of skills and techniques which required a degree of sophistication that the children had not acquired. Over-expectation often led to children becoming discouraged and tentative in their approach to their work.
7 Under-expectation was recorded where there was evidence that the work required of children was too easily achieved and did not make appropriate demands on the children's developing capacity to observe, discriminate or make informed choices. Where there was insufficient stimulus in the tasks presented to the children the pace of work was sometimes slow because of boredom and easy distraction, or rushed because it required little thought; there was often a lackadaisical approach to the work, poor presentation and slipshod errors. In some cases the range of work was narrow and undemanding and children were not being introduced to skills and techniques which would normally be mastered by children at that age and level of ability. Under-expectation often took the form of children being required or allowed to repeat work already understood or mastered instead of being challenged by new skills and ideas.
8 A reasonably satisfactory match was recorded when there was evidence of ordered and planned progression building on existing knowledge and skills and leading to the acquisition of further skill, information or understanding. The tasks presented to children required the use of an appropriate range and variety of books and materials and there was evidence of increasing skill in recording observations and in the ability to discriminate and to evaluate evidence. Where a reasonably satisfactory match was achieved children were normally confident in their work and not afraid to make occasional errors which they regarded as a stimulus to further effort; children displayed a sense of purpose in their work and appeared to enjoy the challenge of increasing, though realistic, demands made upon them. Many children gained satisfaction from the mastery of new skills and techniques and often displayed considerable persistence in achieving standards which satisfied themselves and their teachers.
[page 209]
SUMMARY OF SCHEDULES
9 The following summarises all the factors referred to in the HMI Schedules for the inspection of the survey classes.
Aesthetic and physical education
i. Art and crafts
1 The extent to which children make use of the following starting points and resources in the development of aesthetic awareness: the immediate outdoor environment, arrangements and displays inside the school and the classroom, natural and man-made objects, a range of media for two and three dimensional work, visits to local art galleries, exhibitions or museums, visits by local craftsmen or artists.
2 The quality of the following resources: the arrangements and displays within the classroom including man-made objects, a range of media for drawing and print-making, materials and textiles, three dimensional constructional materials.
3 The emphasis given to art and crafts within the whole curriculum.
4 Evidence that children are learning to observe carefully in relation to form, texture, pattern and colour.
5 Evidence that children may turn readily to paint, clay or other media when they have something to express which is personal to them.
6 Evidence of the use of form, texture, pattern and colour in children's work.
7 Evidence that children are learning to select materials with discrimination.
8 Evidence that the children are learning to handle tools, apparatus and materials carefully and safely and with a sense of fitness for their purpose.
9 The use made of drawing and modelling techniques and skills to record observations or information in other areas of the curriculum.
[page 210]
ii. Music
10 The extent to which children make use of the following starting points and resources for musical experience: recorded music, television, radio, untuned and tuned percussion instruments, visits to concerts or to hear outside choirs, visits to the school by musicians.
11 The emphasis given to music within the whole curriculum.
12 The extent to which opportunities are taken to develop singing, listening, the learning of notation and creative music-making as aspects of musical experience.
13 The quality of the songs chosen.
14 The extent to which music is related to other areas of the curriculum.
15 The provision for children in the class to play musical instruments.
iii. Physical education
16 The extent to which children make use of the following starting points and resources for physical education: television, radio, gymnastic equipment of all kinds, games equipment and associated small apparatus.
17 The emphasis given to the full range of movement activities within the whole curriculum.
18 The extent to which opportunities are taken to develop gymnastics, dance, games and swimming within the range of physical activities.
19 Evidence that the children are developing skilful performance in gymnastics, skill in games or a games-like context, awareness and sensitivity in the use of expressive movement.
Language and literacy
1 The extent to which children make use of the following starting points and resources to develop and extend their language, whether spoken, written or through reading:
[page 211]
a. experiences out of school which have not been planned by the school
b. experiences in school including the display of materials and objects, the keeping of animals and plants, imaginative play, constructional activities
c. book collections or libraries
d. television, radio, cine film, slides, pre-recorded material for listening, tape recordings by the children
e. reading schemes and courses, assignment cards, language course kits, textbooks
f. stories and poems read or told by the teacher
g. visiting speakers
h. the immediate outdoor environment, visits and school journeys.
2 The quality of the following: the arrangement of displays, book collections or libraries, pre-recorded material for listening, cine film and slides, assignment cards, stories and poems read by the teacher.
3 The extent to which opportunities are taken to develop the language used in other areas of the curriculum.
4 Evidence that children are being taught to do the following: follow instructions, follow the plot of a story, listen to poetry, comprehend the main ideas and the details in information they are given, follow a discussion or the line of an argument and contribute appropriately.
5 The emphasis given to talking between the children and teachers, and the children and other adults.
6 The emphasis given to informal discussion among children during the working day and the provision of more formal, structured arrangements for discussion and exchange between children.
7 Evidence that children are encouraged to expand their spoken responses, that new vocabulary is introduced, that the use of more precise description is achieved, that children are helped to frame pertinent questions and that
[page 212]
children are taught to use alternative and more appropriate structures in their talking.
i. Reading
8 Evidence, where appropriate, that children's own speech is used to provide early reading material.
9 Evidence that the children's own writing is used as part of their early reading material.
10 The emphasis given to reading practice with main reading schemes and supplementary readers.
11 The emphasis given to the reading of fiction and non-fiction related to curricular work and other reading not related to curricular work.
12 The emphasis on the use of extended reading skills and children's comments on the material read.
13 The emphasis on the selection of books by the children themselves.
14 Evidence that children learn to turn readily and naturally to books for pleasure and that they use books with ease and confidence as a source of information.
15 Evidence that the children read poetry and that some of the children discuss books at more than a superficial level.
ii. Writing
16 The emphasis given to self-chosen and prescribed topics for children's writing.
17 The emphasis given to self-chosen and prescribed topics related to other curricular areas.
18 The extent to which the following are used: copied writing, dictation and handwriting practice.
[page 213]
19 The extent to which descriptive, expressive, narrative and expository styles or modes of prose writing are used by the children.
20 The extent to which descriptive, expressive and narrative styles or modes of poetry writing are used by the children.
21 Evidence that the children's writing is used for the following purposes: to share information or experience with other children, as samples of work used by the teacher to monitor progress, as a basis for learning language, spelling, syntax and style.
iii. French
22 Where French is taught, the number of sessions and total time per week which is spent on this subject.
Mathematics
1 The extent to which children make use of the following starting points and resources in the learning of mathematics:
a. television and radio
b. textbooks, commercial and school-made work cards
c. investigations arising from questions asked by the children or initiated by the teachers
d. practice of skills directed from the blackboard.
2 Evidence of sustained work on any mathematical topic.
3 Evidence of profitable links with other areas of the curriculum.
4 The emphasis given to the following aspects of mathematics during the current school year:
a. qualitative mathematical description; unambiguous description of the properties of number, size, shape and position
b. recognition of relationships and logical deduction applied to everyday things, geometrical shapes, number and ordering
[page 214]
c. appreciation of place value and recognition of simple number patterns (eg odds and evens, multiples, divisors, squares etc)
d. appreciation of some broader aspects of number (eg bases other than 10, number sequences, tests of divisibility)
e. use of various forms of visual presentation (eg three dimensional and diagrammatic forms, statistical charts, tables of data, networks etc)
f. use of models, maps, scale drawing etc
g. use of algebraic symbols; notations such as 'box' and arrow diagrams
h. sensible estimation and use of measurements of length, weight, area, volume and time
i. understanding of money and sense of values regarding simple purchases
j. quantitative description; sensible use of number in counting, describing and estimating
k. practical activities involving the ideas of +, -, x and ÷
I. suitable calculations involving +, -, x and ÷ with whole numbers
m. examples involving four rules of number including two places of decimals (as in pounds and pence and measures)
n. calculations involving the four rules applied to the decimal system
o. use of fractions (including the idea of equivalence) in the discussion of everyday things
p. competence in calculations involving the four rules applied to fractions.
Science
1 The extent to which children make use of the following starting points and resources in learning science:
a. children's experience out of school
[page 215]
b. experience of materials, plants and animals in school
c. television and radio
d. reference books, textbooks, commercial and school made assignment cards
e. the immediate outdoor environment.
2 Quality of the overall provision of resources for scientific investigation.
3 The emphasis given to science within the whole curriculum.
4 The quality of assignment cards, reference books and materials available for scientific investigation.
5 Evidence of investigations arising from questions asked by the children.
6 Evidence that the children are using description arising from direct observation.
7 Evidence that the children are learning about the following:
a. notions of stability and change in relation to living things and materials
b. knowledge of some of the characteristics of living things including differences and similarities
c. reproduction, growth and development in succeeding generations
d. forms of energy sources and storage
e. factors which influence personal and community health, including safety
f. respect and care for living things.
8 The extent to which children are encouraged to identify significant patterns (eg the way plants react to light, the way materials react to heat, bird migration, the position of leaves on a plant stem etc).
[page 216]
Social abilities
i. Social, moral and religious education
1 The extent to which situations are planned to encourage the development of moral and ethical values in the following aspects:
a. the use of initiative and making informed choices
b. the exercise of responsibility and self-assessment in behaviour and work
c. emotional development and sympathetic identification with others
d. respect for other people
e. respect for plants and animals
f. respect for things
g. contribution and participation as a member of a group
h. the exercise of qualities of leadership.
2 The extent to which most children appear to be involved in the development of religious ideas and moral or ethical rules and values during the school assembly.
3 The extent to which children learn about man's attempt to frame religious and moral or ethical rules and values in the following aspects of their work:
a. history and geography
b. the Old and New Testament
c. writings of other religions
d. myths and legends
e. other literature and drama.
ii. Geography and history
4 The extent to which children make use of the following starting points and resources to develop historical and geographical awareness:
[page 217]
a. the memories of people known to the children
b. artefacts, historical documents and the use of historical aspects of the local area
c. historical programmes on television and radio
d. history textbooks, work cards or assignment cards
e. stories with an historical setting
f. history reference books
g. weather study
h. use of geographical features of the local area
i. geographical programmes on television and radio
j. geography textbooks, work cards or assignment cards
k. stories with an interesting geographical setting
l. geography reference books.
5 The quality of the content of school-made assignment cards for history and geography.
6 The quality of history and geography reference books.
7 The emphasis given to developing children's awareness and appreciation of the past.
8 The extent to which children are becoming aware of historical change and the causal factors in relation to people's material circumstances, the way people behaved and the things people believed in the past.
9 The degree to which children are engaged in the following activities:
a. understanding the nature of historical statements
b. developing sympathy with the predicament of other people
[page 218]
c. developing an awareness of the need for evidence.
10 The emphasis given to geographical aspects of children's learning within the whole curriculum.
11 The degree to which the following geographical aspects were included in children's work during the current academic year both within and outside the locality:
a. population and settlements
b. agriculture and industry
c. transport
d. geographical land features
e. natural resources.
12 The extent to which the children's work reveals an appreciation of man's dependence on natural phenomena and resources.
13 Evidence that children are becoming familiar with maps of the locality, atlases and globes.
Organisation and methods of working
1 The emphasis given to cognitive, social, emotional and physical development as judged by the quality of the children's work.
2 The degree to which posts carrying particular organisational or curricular responsibilities influence the work of the school as a whole.
3 The extent to which didactic and exploratory approaches to teaching were observed in the survey classes.
4 Evidence of effective interaction between the basic skills of numeracy and literacy and the more imaginative aspects of the children's work.
5 Evidence that children are encouraged to follow a sustained interest in the course of their work.
[page 219]
6 The extent to which a quiet working atmosphere is established when this is appropriate.
7 The degree of control over the children's use of resources in the classroom.
8 The degree to which the content of the children's work is prescribed by the teacher.
9 Evidence that satisfactory educational use is made of spontaneous incidents which may arise.
10 The attention given to creating an intellectually stimulating environment inside and outside the school.
11 Evidence that vandalism outside school hours limits the creation of an aesthetically pleasing environment.
12 The extent to which the accommodation facilitates or inhibits the children's work.
13 The extent to which the adequacy of resources facilitates or inhibits the children's work.
14 Type of catchment area and whether there is evidence of marked social difficulties.
[page 220]
Index
Major references are set in bold type
A
abilities
cognitive: 5.10-5.13, 5.67
social: 5.6-5.9
accommodation: 2.1, 2.17, 8.14-8.15
adults helping in school: 3.15-3.16, 5.23, 7.6
advisory services: 8.55, 8.68
aesthetic education: 5.85-5.104
agreed syllabus: 4.6. 5.116
art
general: 3.8, 5.13, 5.86-5.95, 8.15, 8.29
match assessments: 6.18
responsibility for: 4.4
assembly: 5.101, 5.120-5.121
assessments
match: 6.13-6.21, 7.2, 7.13, 7.20, 7.25, 7.33, 7.34, 7.36
by teachers: 8.58-8.59, 8.61
assignments
individual: 3.7, 5.52, 5.127, 7.24, 8.22, 8.32
cards: 5.45, 5.74, 7.24
atlases: 5.133, 5.136
attainments: 6.22-6.32
attitudes, skills and: 5.1-5.16
B
basic skills (gen): 6.1, 8.16-8.23, 8.28, 8.32
Bible: 5.119
biology: 5.79
birthrate, fall in: 8.8
blackboard, use of: 5.33, 5.54, 7.31
books
graded readers: 3.7, 5.26, 5.27, 5.47, 6.5
information: 5.28, 6.5
for pleasure: 5.28
fiction: 5.28, 6.5
non-fiction: 5.28, 6.5
reference: 5.47, 5.74, 5.126, 5.127, 5.133
supplementary readers: 5.26, 5.27
text: 3.7, 5.45, 5.53, 5.54, 5.74, 5.126, 5.133, 7.24
British Amateur Gymnastics Association
awards: 5.111
buildings: 8.12-8.15
Bullock Report: 5.2, 5.20, 5.33, 5.35, 5.49
Burnham Committee: 2.13
C
calculating: 5.1, 5.55, 5.58, 6.7
children (see also pupils)
admissions: 3.2, 7.21
individual: 6.10
with learning difficulties: 3.4
with ESL: 2.21, 8.37, 8.39
needs: 8.33
class
selection of: 1.3
size: 7.10 7.17-7.18, 8.4, 8.50
classes
age range: 7.19-7.21
grouping within: 3.6, 3.8, 7.23
characteristics of: 8.4
mixed ability: 3.5
mixed aged: 3.2, 7.19, 8.10, 8.51, 8.52
sample: 1.5
streamed: 3.3, 7.22
vertically grouped: 3.5, 3.9, 7.19, 7.21
classrooms
mobile: 2.17
separate (see also space): 2.1, 2.17, 8.14
[page 221]
classifying: 5.12, 5.13
collections: 5.72, 5.124
computation (see also calculating): 5.15
computer: 1.9
consultation
with head: 4.5, 8.46
between schools: 4.11
continuity
between schools: 4.9-4.11, 8.31
craft: 3.8, 5.13, 5.14, 5.86-5.95, 8.15, 8.26, 8.29
responsibility posts for: 4.4
curriculum
general: 8.16-8.39
priorities: 8.30
range of: 6.1, 6.2, 8.28-8.31
scope of: 6.1-6.9
sex discrimination: 3.8, 5.95, 5.105, 8.29
D
dance: 7.9
didactic approach: 3.19, 3.20, 7.25, 7.27
discriminating: 5.12
discussion
pupils: 5.21, 5.23,5.54
display
of work: 2.20, 5.88
of objects: 5.71, 5.86, 5.87
drama: 5.2, 5.25, 5.121, 8.15
drawing: 5.14, 5.87, 5.92, 5.93
E
Education Act 1944: 5.116
educational progress: 8.29
English, language - see language
special needs: 2.21-2.25, 8.36, 8.37
environment
learning: 2.20
school: 5.40, 5.115, 5.129, 5.131, 7.8
equipment - see resources
experiences, use of children's: 5.39
exploratory approach 3.19, 3.20, 3.22, 7.25
F
faiths (other than Christian): 5.118, 5.122
falling rolls: 8.8-8.11
French: 5.102, 8.40
G
games: 5.109, 5.112, 6.5
responsibility for: 4.3, 4.4
generalising: 5.13
geography:
general: 5.14, 5.22, 5.63, 5.93, 5.118, 5.129-5.136, 6.6, 8.24, 8.26, 8.29
match assessments: 6.19
globes: 5.133, 5.136
groups
ability: 3.6, 5.54, 5.65, 8.32
match assessment of: 6.13-6.21
mixed ability: 3.8
mixed age: 3.1, 3.2
selection of: 1.3, 6.10
use of: 5.7, 8.22,8.32
withdrawal: 7.4
gymnastics: 5.106, 5.110, 5.111, 6.5, 7.9
H
hall: 7.9, 8.15
handwriting: 5.34, 6.5
head teachers statements: 5.6, 5.19, 5.51, 5.67, 5.86, 5.96, 5.117
history
general: 5.14, 5.22, 5.93, 5.118, 5.123-5.128, 8.24, 8.26, 8.29
match assessments: 6.19
HMI: 1.7, 1.8
I
inspection: 1.7
L
language: 3.9, 5.2, 5.17-5.49, 6.5, 6.7, 6.9
centres: 2.25
comprehension: 5.21
discussion: 5.21, 5.23
kits: 5.45
listening skills: 5.19, 5.20-5.21, 6.5
match assessments: 6.14, 6.16, 6.20
responsibility for: 4.3
spoken: 5.19, 5.20-5.25, 5.29, 5.48, 6.2, 6.5, 6.16, 7.8
written: 5.14, 5.19, 5.29, 5.31-5.38, 6.2, 6.5, 6.16, 7.10
[page 222]
learning, aspects of: 5.2-5.16
learning difficulties: 3.4, 8.39
library, libraries: 2.16, 5.44, 7.30
literature, use of: 6.2
living things: 5.70, 5.72, 5.77, 8.24
local authorities: 7.5, 8.9, 8.54
M
maps, use of: 5.14, 5.131, 5.136
match assessments: 5.17, 6.13-6.21, 7.2, 7.13, 7.20, 7.25, 7.33, 7.34, 7.36, 8.28, 8.33, 8.35
match, definition of: 6.12
mathematics: 3.6, 5.50-5.65, 5.93, 6.8, 6.9, 6.22, 8.21, 8.29
attainments in: 6.22-6.32
basic skills of: 5.51. 6.5, 7.31, 8.16
arithmetic: 5.50, 8.22
calculations: 5.55, 5.58, 6.7, 7.31, 8.22
decimals: 5.58, 8.22
estimating: 5.57
everyday situations: 5.15, 5.64
four rules: 5.51, 8.22
fractions: 5.58, 8.22
graphical presentation: 5.14, 5.61
match assessments of: 6.15, 6.16, 6.20, 8.21
measurement: 5.57, 5.59, 5.63
money: 5.59
multiplication tables: 5.56, 5.65
practical: 5.57, 5.58, 7.31, 8.22
symbols: 5.60
responsibility for: 4.4, 4.5
tests: 1.4, 5.64, 6.22, 6.28-6.32, 8.21
use of techniques: 5.15
measurement: 5.13, 5.14, 5.59, 5.63
models, use of: 5.14, 5.62
modelling: 5.89. 5.93, 5.95
moral education: 5.5-5.9, 6.2, 6.5, 8.24, 8.29
movement: 5.102, 5.109
multicultural society: 8.24
music: 3.9, 5.2, 5.96-5.104, 5.121, 6.5, 8.27, 8.29, 8.35, 8.54
making: 5.100
match assessments: 6.18
responsibility for: 4.2
peripatetic teachers: 5.97, 5.104, 6.18, 8.35
singing: 3.9, 5.103, 6.5, 7.10
musical instruments: 5.99, 5.100, 5.101
musical notation: 5.99
N
National Foundation for Educational Research: 1.4, 1.9, 6.22, 7.11, 7.17, 7.18, 7.20, 7.22, 8.28, 8.34, 8.37, 8.51
Nuffield Foundation: 5.82, 8.65
O
observation: 5.12, 5.13, 5.14, 5.67, 5.70, 5.78, 5.80, 5.87, 5.94, 5.135
organisation
classes: 3.1-3.10, 8.10-8.14
schools: 8.8-8.15
P
painting: 5.14
parents: 3.16, 8.68
participation, pupils: 5.6, 5.121, 6.5
physical education: 3.8, 3.9, 5.105-5.114, 6.5, 7.9, 8.15, 8.27, 8.29
dances: 7.9
games: 5.109, 5.112, 6.5
gymnastics: 5.106, 5.110, 5.111, 6.5,7.9
match assessments: 6.16, 6.21
movement: 5.102, 5.109
responsibility for: 4.3
physical science: 5.79
play: 5.41
Plowden report 8.68
poetry: 5.20, 5.28, 5.42, 7.30
practical work: 3.16, 5.57. 5.58, 5.94, 8.22, 8.23
projects - see topics
pupils
able: 2.16, 3.10, 5.64, 6.13, 6.15, 7.36, 8.21, 8.33, 8.35
average: 6.13, 6.15
less able: 2.16, 3.10, 6.13, 6.15, 8.33
boys-girls: 8.29
pupil-teacher ratio: 7.4, 7.6, 7.10
Q
questionnaires: 1.7
questions, asked by children: 5.24. 5.78
[page 223]
R
radio: 5.22, 5.43, 5.73, 5.98, 5.109, 5.134
reading: 3.6, 5.19, 6.5, 5.26-5.30, 7.29, 6.7, 8.16
attainments in: 6.22-6.27
extension of: 5.27
match assessments of: 6.14, 6.16
practice: 5.26, 6.7
remedial: 2.25
responsibility for: 4.3
schemes: 5.26, 6.7
skills: 5.11, 6.14, 8.17, 8.19
standards: 5,17, 8.18
teaching of: 3.13, 5.1
tests: 1.4, 6.24-6.27, 8.18
recording, by children: 5.14-5.15, 5.66, 5.78, 5.88, 5.92, 5.94
records
folders: 4,7, 4.9
lea: 4.9
samples of work: 4.7
school: 4.7, 4.9
use of children's work: 5.38
religious education: 5.93, 5.116-5.122, 8.24, 8.29
remedial teaching: 2.16, 5.29, 7.4, 8.54
resources: 2.19, 3.8, 3.18, 5.14, 5.76, 7.5, 7.10, 8.9, 8.12-8.15, 8.68
equipment: 3.8, 3.9, 5.7, 5.14, 5.66, 5.76, 5.107, 8.9, 8.13
facilities: 5.114
materials: 3.8, 5.89, 5.94, 8.9
tapes: 5.43
use of: 3.21, 5.84
responsibility; curricular and organisational: 2.14-2.16, 4.1-4.6, 6.18, 7.34-7.37, 8.27, 8.35, 8.45-8.47, 8.52
training for: 8.62-8.64
responsibility, pupils: 5.6, 5.7, 6.5, 8.6, 8.7
S
salary scales: 2.13
sample
design and size: 1.2
stages: 1.3, 1.4, 1.5
schedules, HMl: 1.7, 6.3, 6.4
schemes of work: 4.5, 4.6, 5.128, 8.26
schools
age range: 2.1-2.7
characteristics of: 2.1, 2.2
classification: 1.2
locality: 2.5, 2.6, 2.7, 3.15, 7.3-7.13, 8.11
inner city: 2.6, 2.7, 2.20, 2.22, 3.15, 3.16, 7.4-7.6, 8.36, 8.37, 8.38
marked social difficulty: 2.7, 2.23, 7.6, 7.7
organisation of: 8.8-8.11
other urban: 2.6, 2.19, 2.20, 3.15, 3.16, 7.10, 8.9
rural: 2.6, 2.7, 2.19, 2.20, 3.15, 3.16, 7.7-7.9
social priority: 2.19, 7.6
size: 4.2, 8.8, 8.9, 8.48, 8.52
2 fe: 2.15, 4.3, 8.9
3fe: 2.15, 4.4
type: 2.3, 2.4, 7.14-7.16
infants: 3.2, 4.7, 4.9, 8.10, 8.11
juniors: 4.7, 8.10, 8.11
infants with juniors: 2.15, 7.7, 8.10, 8.11
middle: 1.2, 2.3
Schools Council: 5.82, 8.65
science
general: 5.13, 5.14, 5.66-5.84, 6.6, 8.15, 8.26, 8.29
experimental work: 8.26
hypothesising: 5.66, 5.70
match assessments: 6.17
observation: 5.12, 5.66, 5.70, 5.74. 5.78, 5.87, 5.94, 5.135, 8.26
recording in: 5.66
responsibility for: 4.4, 5.84
standards of: 5.84
support for: 5.82
singing: 3.9, 5.103, 6.5, 7.10
site, use of: 2.18
social abilities
consideration for others: 5.7, 6.5, 8.7
feelings, emotion: 5.8
leadership: 5.6
participation: 5.6, 5.121, 6.5
respect: 6.5
responsibility: 5.6, 5.7, 6.5, 8.7
using initiative: 5.7
social education: 5.5-5.9, 6.2, 6.5
social studies: 5.115-5.136
space
open: 2.17
shared: 3.8
use of: 8.14
spare: 8.15
teaching: 2.1
working: 8.14
spelling: 5.38, 5.45, 8.20
staffing
stability: 2.12
[page 224]
standards: 7.34, 8.51, 8.52
turnover: 7.4
standards of work: 5.84, 6.1, 6.20, 6.21, 8.39
statistical techniques: 1.9
stories, use of: 5.20, 5.22, 5.42, 5.119, 5.126, 7.8, 7.30
students: 8.35, 8.56, 8.57
study, extended: 3.22
survey, design: 1.1
swimming: 4.3, 5.106, 5.108, 6.5
syntax: 538, 5.45, 8.20
T
teachers: 2.8-2.20
centres: 5.82
class: 1.7, 1.9, 3.11, 3.14, 5.49, 6.11, 8.41
deployment of: 3.11-3.14, 8.48-8.52
difficulties experienced: 8.34, 8.35
experience of: 2.11, 7.2
graduates: 2.9
head: 1.7, 1.9, 4.1, 4.5, 7.4, 8.46, 8.52, 8.64
initial training: 2.10, 8.55, 8.59
in-service training: 8.55, 8.59, 8.65
meetings of: 4.11
men: 2.8, 2.13
needs of: 8.25, 8.42
other than class: 3.12, 3.14, 4.2, 5.113, 7.34
probationers: 2.12, 7.2, 8.63
professional development: 8.55-8.65
qualifications of: 2.9
remedial: 2.25
responsibilities of: 2.14, 5.49, 8.5, 8.56
specialist: 5.104, 8.5, 8.35, 8.42-8.44
strengths of: 5.84, 5.114, 6.3, 8.40, 8.44, 8.52
visiting: 8.54
women: 2.8, 2.13
teaching
approach: 3.17-3.24, 7.25-7.37
class: 8.40-8.44
cooperatives: 3.10, 8.44
direct: 5.54
method: 3.17-3.24, 7.25-7.37, 8.60-8.61
specialist: 8.35, 8.40-8.65
space: 2.1
television: 5.22, 5.43, 5.54, 5.73, 5.98, 5.125, 5.134
tests
diagnostic: 4.8, 8.59
mathematics: 1.4, 5.64, 6.28-6.32, 8.21
objective: 1.4, 1.9, 6.22
reading: 1.4, 5.17, 6.23-6.27, 8.18
school devised: 4.7
selection of pupils: 6.22
scores for: 6.25-6.28
standardised: 4.8, 8.59
thematic approach: 5.115
tools, use of: 5.14
topics: 5.118, 5.123, 5.128, 5.129, 6.19
transfer: 8.31
transition, between classes: 4.7-4.8, 7.21
V
vandalism: 2.20
vertical grouping: 3.2, 3.5, 7.19, 7.21
visits
to other schools: 4.10
by pupils: 3.16, 5.91, 7.8
visitors, use of: 5.42, 5.91
vocabulary: 5.24
W
weather study: 5.135
West Indian speech patterns: 2.24
withdrawal
area: 2.1
of pupils: 3.10, 5.29, 7.4, 8.49
work
cards: 3.7, 5.52, 5.53, 5.65, 5.126, 5.133, 7.30
inspection of: 1.7
levels of difficulty: 6.20, 6.21
planning of: 5.128
programme of: 4.1, 4.6, 8.32, 8.46
quality of: 1.8, 4.6, 5.104, 5.110, 6.1
range of: 7.33
standards of: 6.1
working atmosphere: 3.17, 7.28, 8.6
writing: 3.6, 5.14, 5.19, 5.29, 5.31-5.38, 8.20
copied: 5.33
descriptive: 6.5, 8.20
narrative: 6.5, 8.20
skills: 5.14, 5.19, 5.34, 5.37, 5.38, 5.45, 8.20
written work, use of: 5.37, 5.38, 6.5, 7.10