[page 347]
APPENDIX 9
THE MANCHESTER SURVEY:
FOREWORD
1. The survey contained in this appendix was made by a team from the School of Education, University of Manchester, directed by Professor Stephen Wiseman, and is concerned with ten year old children in the Manchester area.
2. The note contained in the rest of this Foreword has been written jointly by the authors of this survey and of Appendix 4.
3. The attentive reader is bound to notice some striking differences between the tables of Appendix 4 and those of Appendix 9. For example, in Table 8 of the latter 'Size of class' stands out. In Table 4 of the former it does not appear at all. Since this can hardly mean that 'Size of class' is peculiarly important in Manchester some other explanation must be sought.
4. In fact the explanation is to be found in the difference between the methods used for summarising the evidence. In both cases the evidence before it is summarised consists of a large number of correlation coefficients. Thus for the analyses between schools in Appendix 4 there were 104 variables and six age and sex groups, giving 33,072 coefficients in all. For the Manchester evidence there were 87 variables, giving 3,741 coefficients. These numbers remind us of the bishops in the Gondoliers, who were in point of fact too many. They must be reduced to put the evidence into a more comprehensible form.
5. In both cases the reduction is made by replacing the original variables by composite variables which are weighted sums of the originals. But different principles are used to obtain the weights. In the factor analysis used to reduce the Manchester data the principle is to choose the weights so that the 87 original variables, which are correlated, are replaced by 87 composites which are not. At first sight this seems little improvement, but the advance lies in the fact that nearly all the variation is concentrated in the first six composites (and about three quarters of it in the first one) so that the rest may reasonably be discarded as unimportant. This is not quite the whole story. There is in fact an infinite number of sets of uncorrelated composites that contain the same information as the original variables, so that further principles of choice are needed. After the factor analysis has been done, the factors are 'rotated' by the computer so as to achieve what is known as 'simple structure': i.e. a set which maximises the number of zero or near-zero loadings in each factor. This produces a simplification of the 87 composites, so that each one now covers only a proportion of the original variables; its effect is concentrated over only part of the total field. It so happens in this analysis that nearly three quarters of the total variation in the educational tests is concentrated in the first factor. A consequence of this is that the weights (or loadings) of the other variables in the first composite (or factor) are roughly proportional to, but rather greater than, the average correlations of these variables with the educa-
[page 348]
tional tests, as may be seen by comparing Table 3 with Table 8 in Appendix 9. For example, for 'Size of Class' the average correlation is .32, and the loading is .36.
6. In regression analysis, which was used to summarise the evidence from the English sample, the principle is to select one variable as the criterion and reduce the others to a single composite, namely that composite which has the highest correlation with the criterion. In this process, which is described at some length in Section 4 of Appendix 3, the weights (regression coefficients) are not proportional to the simple correlations, because allowance is made for the extent to which the variables in the composite are correlated among themselves. A variable that has a substantial correlation with the criterion may have a negligibly small partial correlation, when the other variables are held constant, and if so it will have no weight in the composite. Because of this only about a dozen of the original 104 appeared in the composite for each age and sex group.
7. Each mode of analysis brings out important facts. For example in the factor analysis the substantial weight given in the first factor to 'Average size of class' brings out the fact that on the whole schools with large classes make somewhat higher scores in the tests than those with smaller classes. But 'Average size of class' has no weight in the regression composite for any age and sex group. This brings out the fact that when the other variables are held constant it is no longer the case that schools with large classes make higher scores in the tests. This applies generally.
8. There are three stages in inquiries of this kind. First the evidence must be collected. Then it must be reduced to a more manageable form. Finally it must be interpreted. The second stage consists first of the choice of the principles to be used for the reduction, and secondly of straightforward though lengthy computations. The choice of the principles for the reduction is a matter of judgement. This choice determines the nature of the computations, which then automatically give the results. The interpretation of the results is again a matter of judgement.
9. Association, though necessary, is not sufficient evidence of causality. For example, a factor loading -or a first order correlation coefficient - showing a positive relationship between size of class and school attainment does not justify the corollary that increasing class size will improve scholastic ability. A similar association with number of books in the home does not mean that if one made a present of a dozen books to a family, this would improve the child's school work. Winning the pools, and thus dramatically raising the family income, is unlikely to have any advantageous educational effects on the children, despite the correlation between income level and attainment. If the school nurse disinfests the hair of one or two children, this is irrelevant to their results on the next arithmetic test, in spite of the Manchester results on 'cleanliness'.
10. What both analyses show is that adverse factors tend to go together; and that of these adverse factors, the most important are those concerned with parental attitude (encouragement, interest and aspiration) which are clearly more important than social class, occupation or income. School variables are further down the list, and here the adverse factors - like those in the home - hang together, as might be expected.
[page 349]
11. It is when the interested reader looks at individual variables (such as size of class, or streaming) hoping to find support for his own beliefs or ammunition against his opponent, that the greatest care must be exercised in interpretation, and where our warnings against the assumption of causality are most needed. An appropriate approach here is the Bayesian one: to accept that the weight of the evidence needed depends upon the nature of the conclusion. If a conclusion is no more than a quantification of a general proposition acceptable to the common sense of those who know something about the matter in hand comparatively little weight is needed to support the quantification. If, on the other hand, any result appears to fly in the face of such common sense then very heavy weight is needed. Thus a result that 30 per cent of the school achievement was owing to (caused by) their parents' attitudes, and 20 per cent to their parents' material circumstances, is a mere quantification of the view, which most sensible men would accept, that part must be owing to the one and part to the other. On the other hand, a result that, other things being equal, the achievement would be improved (a statement of causality) by giving the teachers more pupils to cope with is contrary to the common sense of sensible men, and therefore needs very heavy weight and much more supporting evidence before such a jump from association to causality can be made. One naturally looks to alternative explanations of the association. Bayes' point that the posterior probability is the product of the prior probability and the likelihood is a most important one, particularly since readers of educational research are often prone to seize on isolated results and either accept them as evidence of propositions that are very hard to believe, or alternatively as evidence that the whole effort is completely worthless.
THE MANCHESTER SURVEY
BY STEPHEN WISEMAN (1)
12. Our brief for this inquiry was to investigate the relationship between the educational attainment of primary school children and environmental factors, with particular reference to the environment within the school. The design of the experiment was controlled by two major considerations: (a) the experience gained in our secondary school surveys in Manchester and Salford in 1951 and 1957 (2), and (b) the necessity for a strict timetable, with the autumn of 1965 as a deadline for the completed Report. This limitation in time affected both the size of the sample, and the type of criterion measure adopted. It was clear that in the time available it would be impossible to construct specially designed measures for our purpose, and we had to rely on existing measures - measures which must, of course, be directly comparable, school with school. We de-
(1) I must acknowledge my indebtedness to Professor Frank Warburton, who was concerned with the project from the start; to Mr Tom Derrick, the Research Officer, who was responsible for collecting the data; to Miss Anne Sutherland and Mr Brian Start, who monitored the computer work; and to the officers of the Manchester LEA, in particular Mr Elliot, the Chief Education Officer, and Dr Laybourne, his deputy, for their willing and wholehearted co-operation. But most of all my gratitude must go to the head teachers and teachers in the sampled schools for their interest, their patience and their invaluable help. Without their full support this inquiry would have been impossible.
(2) Reported in Wiseman, 1964, Education and Environment, Manchester University Press.
[page 350]
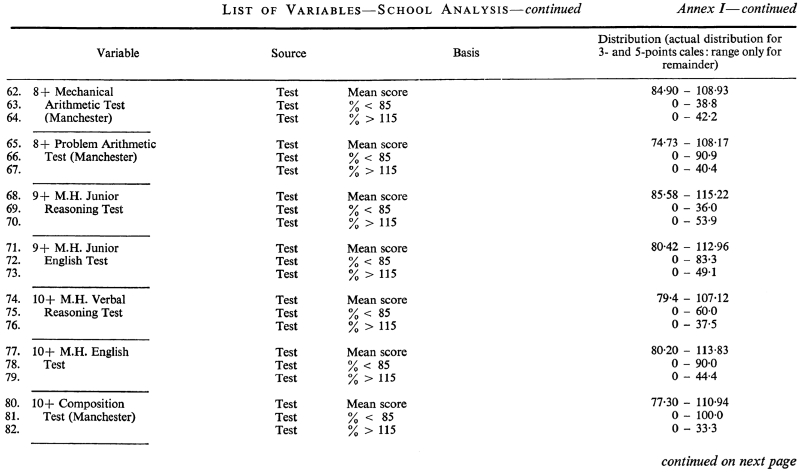
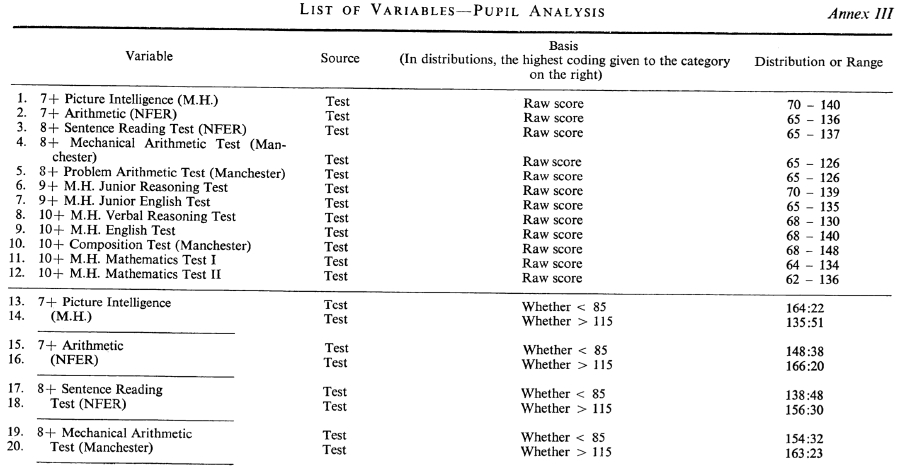
cided to study ten year old children, because these children had received the full impact of primary school education. The ten year olds in 1964 had taken standardised tests at 7+, 8+, 9+ and 10+, and the results of these tests were accepted as our criterion measures. There were 12 such measures:
| 7+ | MH Picture Intelligence
NFER Mechanical Arithmetic |
| 8+ | NFER Sentence Reading
Manchester Mechanical Arithmetic
Manchester Problem Arithmetic |
| 9+ | MH Junior Reasoning
MH Junior English |
| 10+ | MH Verbal Reasoning
MH English
MH Mathematics I
MH Mathematics II
Manchester Composition |
13. The limitations of criterion measures of this kind must be stressed. They consist of tests of the tool subjects only, and, with the exception of composition, they are all objective tests. Such measures are a necessary part of any criterion of primary school attainment, but they are far from giving a balanced picture. No account is taken of the many other activities which go on in the average primary school, the work in art and craft, in music, in science and geography and history, and in the many other pursuits which can often not be classified under the traditional 'subject' labels, but which, nevertheless, are of very great significance educationally. Our choice of criterion measures must not be taken to indicate a belief that the 3Rs are all that matter, nor should the limitations of our tests be forgotten in interpreting the results of our inquiry.
14. Our experience in earlier researches, and the fact that we were particularly interested in the environment within the school, led us to plan the research as a school based one, with the schools as the units. We were anxious, however, to support this main inquiry with a more intensive study of individual children, and we were glad to discover that we could draw on the services of the Social Survey to interview the parents of such a sub-sample. Our inquiry, therefore - and this Report - covers first, the main research comparing schools, and second, a sub-sample research comparing pupils.
Sample of Schools
15. In 1964 there were 176 primary schools in Manchester with children of 10+. Ninety-two of these were county schools, 40 Church of England, 43 Roman Catholic and one Jewish. It was decided to take a 25 per cent sample of these schools, stratified by school type. The two other factors which it was desirable to control in the sample were socio-economic level and school size. Our previous surveys had given us a good deal of information about the distribution of social factors over the city, and it seemed that these could best be controlled by stratifying the sample on a geographical basis. The central area of the city contains the blackest region from the point of view of housing, crime, disease and poverty. The northern extremity - hardly to be called
[page 351]
suburban, since in this direction there is no break in the conurbation - shows a significant improvement over the central area in all social variables, while the southern wards (Didsbury, Withington and Burnage, etc.) contain the 'best' areas within the city boundary. These three divisions of the city could well form the basis of a socio-economic stratification. There remained the extreme southern section formed by the Wythenshawe wards of Northenden, Baguley, Benchill and Woodhouse Park. Our 1951 and 1957 results showed this area to be 'white' on such variables as J-index, Persons per acre and Death rate, but as 'black' as Moss Side on Birth rate, Committals to Care, Cruelty and Neglect, and Children on Probation. A high proportion of residents are from slum clearance areas, and the region is clearly an atypical one and deserving of separation from the rest of the city. As a result of considerations such as this, we stratified geographically as follows:
7 Northern wards
18 Central wards
9 Southern wards
4 Wythenshawe wards
When the 176 primary schools are classified under school type and social district the picture is as shown in Table I:
Table I
All Manchester Primary Schools
| County | CE | RC | Other | Total |
| Northern | 18 | 5 | 8 | 1 | 32 |
| Central | 42 | 28 | 22 | - | 92 |
| Southern | 18 | 6 | 8 | - | 32 |
| Wythenshawe | 14 | 1 | 5 | - | 20 |
| TOTAL | 92 | 40 | 43 | 1 | 176 |
16. In order to control size of school we decided to draw a 50 per cent sample of schools in the first instance, to arrange the schools within each cell in the table in order of size, and to take alternate schools for final 25 per cent sample. This yielded the final sample of 44 schools, shown in Table II, which provide about 2,000 ten-year-old children:
Table II
Sample of Tested Schools
| County | CE | RC | Total |
| Northern | 5 | 1 | 2 | 8 |
| Central | 10 | 7 | 6 | 23 |
| Southern | 5 | 1 | 2 | 8 |
| Wythenshawe | 4 | - | 1 | 5 |
| TOTAL | 24 | 9 | 11 | 44 |
17. Three additional schools were chosen, one County, one CE and one RC, to form pilot schools for Mr Derrick to visit first, to try out his interviewing and recording methods before starting on the sample proper.
[page 352]
Social Survey Sub-Sample
18. Interview load limited the size of the sub-sample of children whose parents were to be interviewed by the Social Survey to 200: i.e. a one tenth sample. Two plans were discussed:
(a) a one tenth sample of all the 2,300 children in the main sample,
(b) a sample of 230 children taken from 10 schools of the 44 in the sample.
Plan (a) covered all the schools, but at the cost of providing, on average, only five pupils per school, and entailing a wider geographical spread for the social survey interviewers. Plan (b) concentrated the interviews, but inadequately covered the schools. And since our inquiry was to be, in the main, school based, this was a serious disadvantage. Finally, and with some degree of hesitation, we settled on the following design:
(a) a randomly selected 50 per cent sample of the 44 schools, stratified as in Table II,
(b) 10 children, randomly selected from each of the 22 schools, irrespective of school size.
I THE SCHOOLS ANALYSIS
Criterion measures
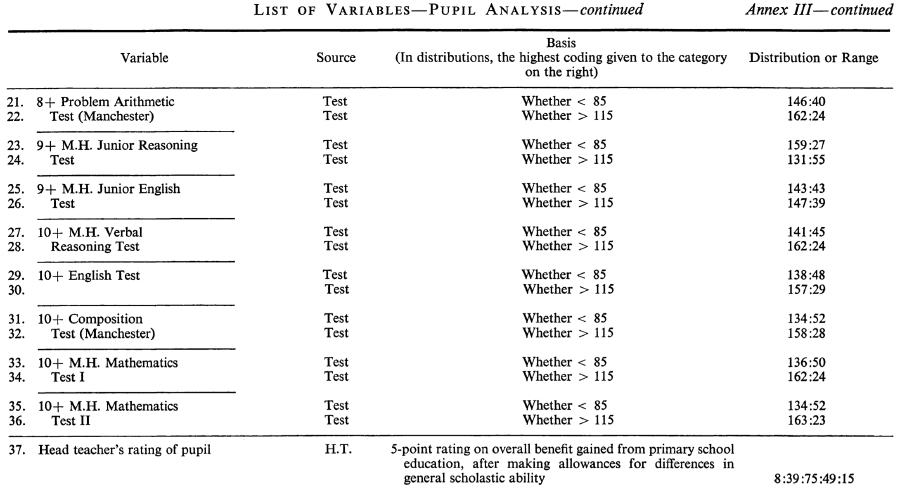
19. Our previous surveys of secondary schools were all school-based, and we had then discovered the value of employing measures of attainment which covered intensity of 'backwardness' and 'brightness' as well as the average level of ability in a school. As I have said elsewhere, 'this gives a richer and more meaningful result than using a single average score. Certainly from the teacher's point of view these two percentages mean much more than an average score, since they demonstrate so clearly the teaching problem by indicating the spread of ability. Two schools may have identical average scores, but if one has 10 per cent backward children and 10 per cent bright, while the other has one per cent and one per cent, they are very different schools to the teacher'.* We used the same - arbitrary - measures of 'backwardness' and 'brightness' as we had used earlier: the percentage of pupils with a standard score of 85 and below, and of 115 and above.
We thus had twelve tests, with three measures from each test: a total of 36 criterion scores.
School Environment
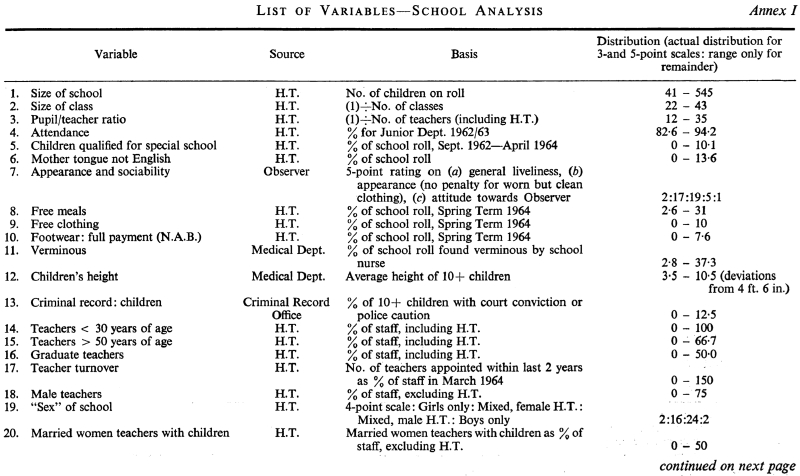
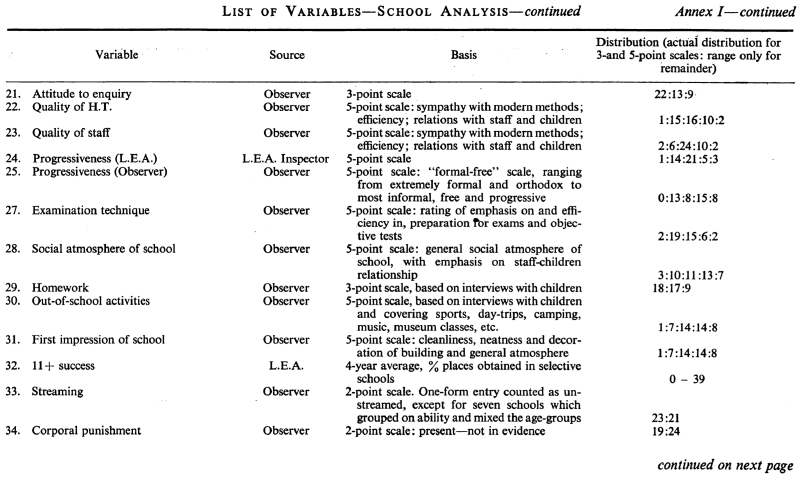
20. Professor Warburton's 1951 inquiry in Salford has shown that subjective estimates of 'progressiveness', socio-economic status and quality of school buildings could be more valuable than the objective measures of attendance, class size and date of school building. This finding led us to search for ratings that might reasonably be expected to pinpoint some of the elusive components of 'school atmosphere'. As a result of preliminary meetings with the head teachers of the primary schools involved, and discussions with representatives of the LEA and with colleagues in the University, we finally decided upon 34 school environmental variables of which 16 were at least partly subjective.
*Education and Environment, p. 78.
[page 353]
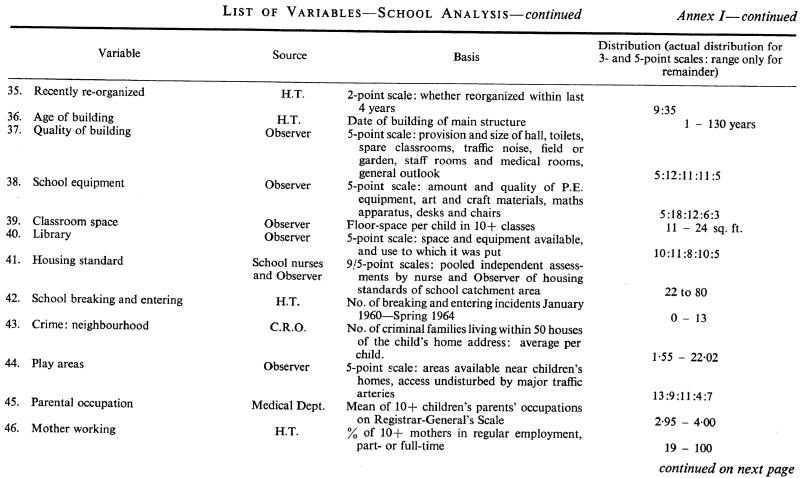
21. Most of the information on the straightforward, objective variables was supplied by the head teachers in reply to questionnaires. Size of Class, Size of School, and Percentage Attendance, which had proved useful enough in Salford, were obvious first priorities.
22. So many schools are experiencing staffing difficulties these days that we decided to include some variables that might reflect particular aspects of this problem. Articles in educational journals and letters to the press constantly comment on the damage to our children's schooling caused by too many staff changes, and by the need to recruit large numbers of married women whose first loyalties may be to their own families. One reads, too, of the trials facing newly qualified young teachers, especially in 'tough' areas. There is discussion, too, about the balance of the sexes in teacher training, and the desirability of training more men than previously for primary work. Despite the fervour of many writers on these problems, very little is actually known about the influence of different categories of teachers on primary schooling. We therefore included the following variables in our survey to see if they linked up in any way with measures of academic achievement or school atmosphere: Proportion of Teachers under 30 years of Age, Proportion of Teachers over 50 years of Age, Turnover Rate, Percentage of Graduates on the Staff, Sex of the Head Teacher and Proportion of Men on the Staff. From the information supplied by the questionnaire, it was possible to work out the teacher/pupil ratio. From the heads we also learned how many pupils in each school had qualified for some form of Special Schooling since September 1962. We asked for the various types of special schooling to be detailed in the hope of having additional checks on any areas where physical handicap appeared unduly heavy; in practice, however, the great majority of children involved were the educationally subnormal, and the numbers were in any case low, so that it was not practicable to separate out the different categories. In addition, we obtained the number of incidents of breaking and entering school since January 1960 (strictly speaking, a 'neighbourhood' rather than a 'school ' variable) and, at the suggestion of the head teachers, the number of pupils whose mother tongue was not English. These children are causing a growing teaching problem in many of our larger cities, although perhaps it is not in its most acute form in Manchester.
23. From information supplied by the LEA, we calculated the average ratio of grammar: secondary modern places gained by pupils in each school over a period of four years.
24. The ratings on variables associated with 'school atmosphere' were made by the Research Officer, who spent a day in each of the 44 schools of the sample, after trying out his procedure of interviews and ratings on the three pilot schools. In each school he discussed the home backgrounds of the children with the head and with the staff as a body, but perhaps the most valuable information was gleaned during 15-20 minute visits to nearly every classroom. Naturally, the children's own class teachers tended to know more than did the heads about which children's backgrounds, physically or psychologically, were poor or atypical. Our Observer then chatted to several of the children, either individually or in groups of two or three, as unobtrusively as possible, while the normal classwork continued around them. Some of these
[page 354]
children had been pointed out by their teachers; others he chose at random. Our Observer's talks with the pupils, of course, appeared to them quite informal, but many of the topics he raised were chosen to provide information, directly or indirectly, on the home backgrounds, the leisure opportunities of the neighbourhood and the school atmosphere. For instance, he frequently asked the children what they liked best out of school and where they went to play, who helped them to read, and whether they chose their neighbour in class (to provide a lead on the degree of formality in the classroom organisation). While in each school he also visited the library, the gymnasium, and the art room.
25. After each visit, he rated the school, usually on a five point scale, on the following variables:
(a) First impression of the school: influenced by cleanliness, decoration and any indications of the general atmosphere;
(b) Quality of the building: taking into account the adequacy and attractiveness of classroom, staffroom, playground and toilet facilities, the noise from traffic and the general outlook;
(c) Quality of Equipment: including PE equipment, art and craft materials, mathematical apparatus, and the types of pupils' desks and chairs;
(d) Library: its structure and use. Primary school 'libraries' ranged from a couple of shelves to some of high standard;
(e) Classroom space: an objective rating of the floor space per child in the 10+ classroom(s).
Some variables reflected school organisation and policy:
(f) Recently re-organised from all-age. It seemed possible that in some recently reorganised schools, the ethos of the secondary school might tend to continue in the primary school;
(g) Streaming. Schools with only one stream entry were classified as 'unstreamed' except for seven schools who grouped to some extent on ability and mixed age groups;
(h) Corporal Punishment. The head teachers were not asked directly about its use, but sometimes evidence was gained either from incidents witnessed or in the course of conversation. Thus, the only possible ratings on this variable were 'used' and 'not in evidence', although presumably schools in which no teacher or pupil mentioned corporal punishment would tend to resort to it rarely, if at all;
(i) Homework. From conversations with the children, the Observer gathered how early in the primary course homework was set (if at all) and how much stress was laid upon doing it;
(j) Out-of-School Activities. Again using the children's information, our Observer estimated what opportunities they had for sport, day trips, camping, museum classes and so on.
The other Observer ratings were all planned to capture aspects of the 'school atmosphere'.
(k) Appearance and Sociability of the children. In this purely subjective rating, the most important factors were the attitudes towards, and verbal skills of the children in conversation with, the Observer. 'Appearance' was reckoned only in terms of neatness and cleanliness - no school in the central area was rated low if the children had worn, but clean, clothing;
[page 355]
(l) Attitude of the Staff to the inquiry: a rather coarse three point rating;
(m) Quality of the Head and Quality of the Staff;
(n) Examination Technique: a somewhat tentative rating of how well the school seemed geared to obtaining the best test results from the pupils;
(o) Progressiveness. Since our earlier work had found a more convincing association between progressiveness and school success than had any previous inquiry, we were anxious to investigate this concept further. In Salford, only one rating was made of this quality, that of the LEA; Kemp had two independent ratings, made by himself and by school inspectors, although these assessments were later combined. Our Observer rated each school on progressiveness, basing his estimate on the evidence he saw, during his visits, of modern trends in school work, other than examination techniques. Several of our other subjective variables, however, noticeably 'Appearance and Sociability' and 'Quality of Head and Staff' were undoubtedly connected with progressiveness. In order to reduce the chances of a 'halo' effect distorting our findings, we asked the LEA for certain independent assessments of the schools. The estimate by the Local Authority was almost identical in basis with the Observer's 'Progressiveness'; they rated the schools on a five point scale from 'Informal, free progressive' to 'Formal, rigid, orthodox'.
26. We had planned to include a few variables about Parent-Teacher Associations since this seemed an obvious way of assessing objectively one aspect of parental interest in the school. To our surprise, not one school in the sample had such an organisation.
Home and Neighbourhood Environment
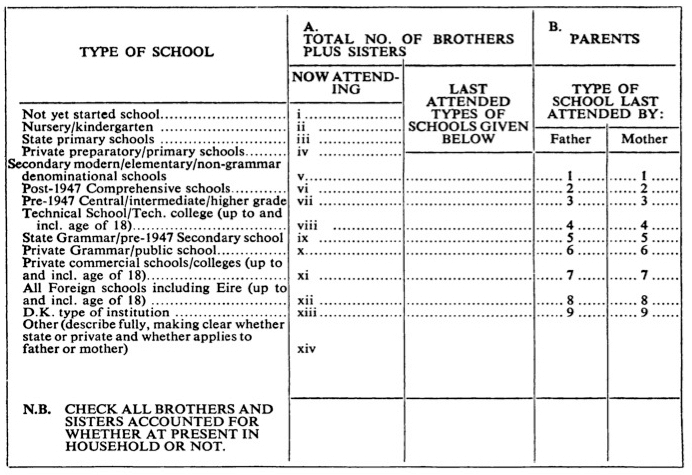
27. In our previous Manchester surveys, social variables were calculated on a ward basis; in 1957, for instance, we allocated each child to the ward of his home address and his 'score' on each social variable was the rating of his ward. This time, however, we concerned ourselves only with the children and families represented in the schools of the sample. Naturally, this approach limited the environmental variables we could use. Birth rate, Illegitimacy, Deaths under one year, useful though they had been in 1957, had, of course, to be dropped. Fortunately, however, many of the variables that had been most closely linked with educational success in 1957 could be calculated on a school, as well as on a ward, basis, and so were used in the present research: Children taken into care, Verminous Conditions, Distribution of Shoes and Clothing either Free, at Part-payment, or at Full Cost (the last category applying to families on National Assistance who still save money as the clothing is cheaper than it would be retail). Head teachers, Medical Officers and Welfare Officers, as seemed most appropriate in each case, informed us of the numbers of children in each school to whom these variables applied. Each head teacher also gave us the number of pupils in his school receiving free meals, another variable clearly related to the economic level.
28. Independent assessments of the standard of housing in the school neighbourhood were made by the School Health Department and by the Observer during his visits. The school nurses had the advantage of some knowledge of the interior state of the houses while our Observer could view them only
[page 356]
externally. These two ratings were pooled. They were very similar to the rating of 'School Neighbourhood' which proved valuable in Salford.
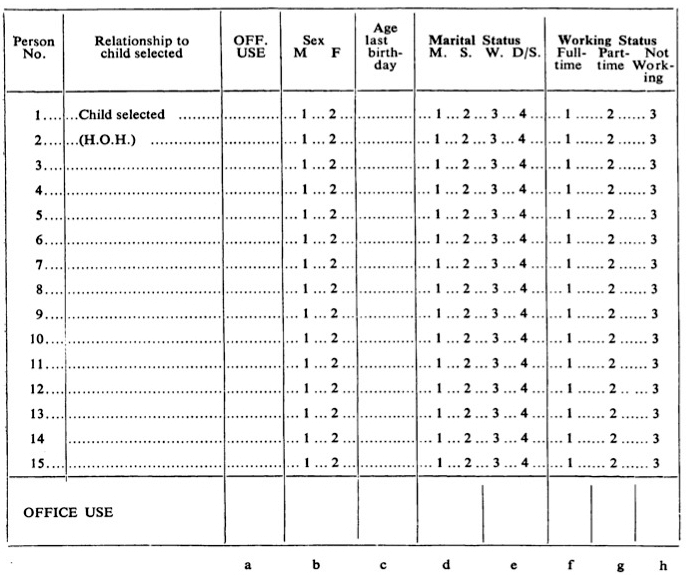
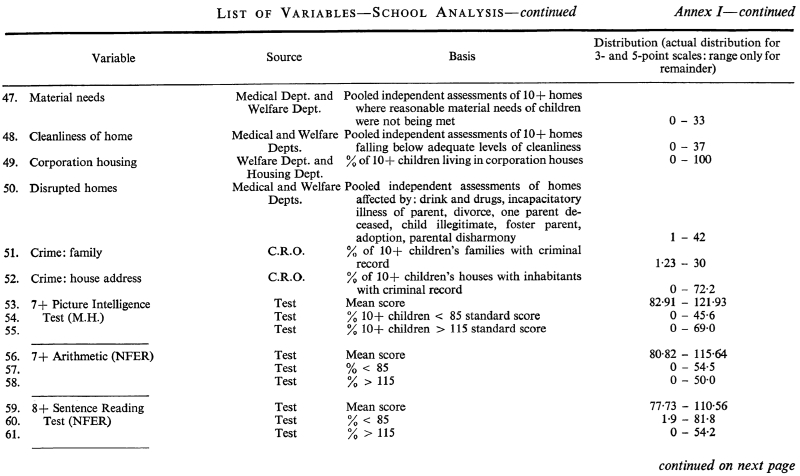
29. To obtain some social data for individual pupils we supplied both the Medical and Welfare departments with a list of the names of the children in the sample and asked them to mark those whose homes, in their confidential opinion, were suffering from any of the following conditions:
(a) Shortage of material needs: the food, clothing, living space that an average home provides;
(b) Clearly classifiable as dirty: this variable is comparable to the 'Cleansing Notices' obtained on a ward basis in 1957;
(c) Disrupted homes, based on information under the following heads:
A parents divorced;
B one parent deceased;
C child illegitimate;
D a foster parent;
E child adopted;
F a history of incapacitating illness in one parent;
G grave emotional tension in the home.
We were especially interested in the correlates of such disrupted homes since Fraser (1959) had shown this factor to be particularly detrimental to school achievement.
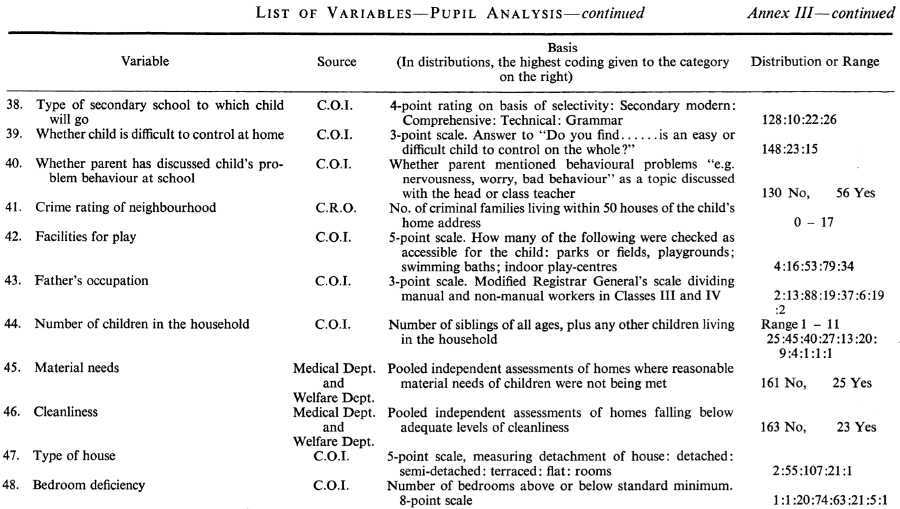
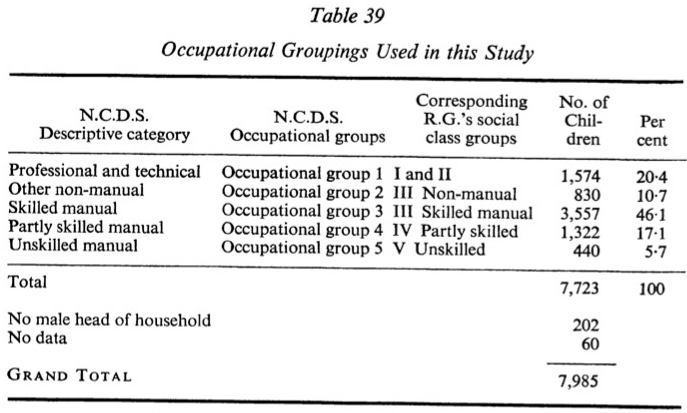
30. Four other pieces of individual data were related to the socio-economic level: Father's occupation (rated on the Registrar General's five point scale); whether the child's mother worked, and whether the family lived in a Corporation house. One physical variable, the child's height was also included.
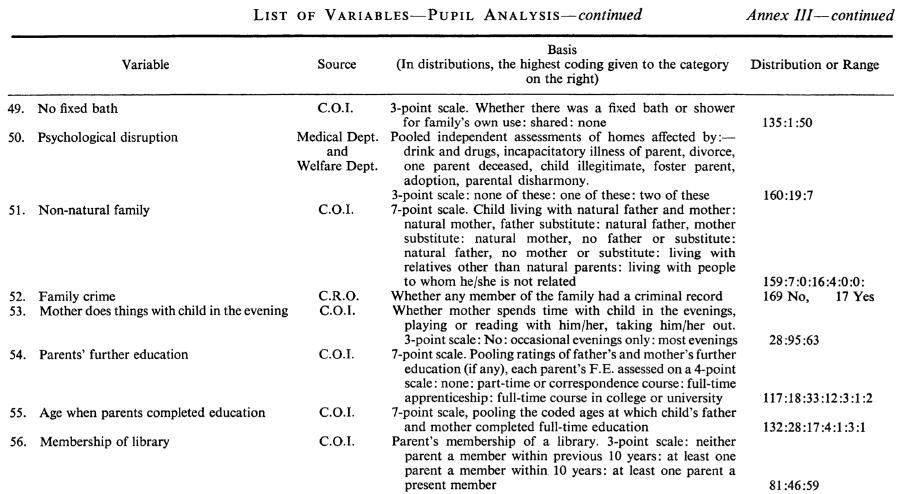
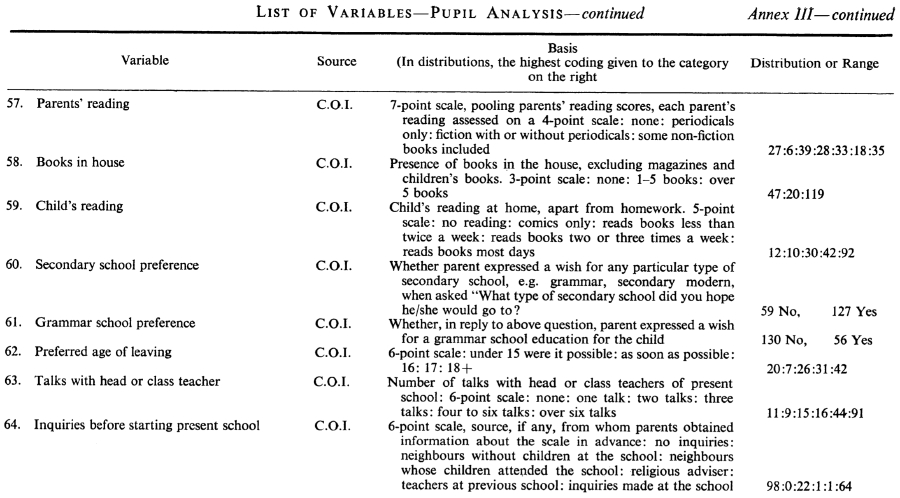
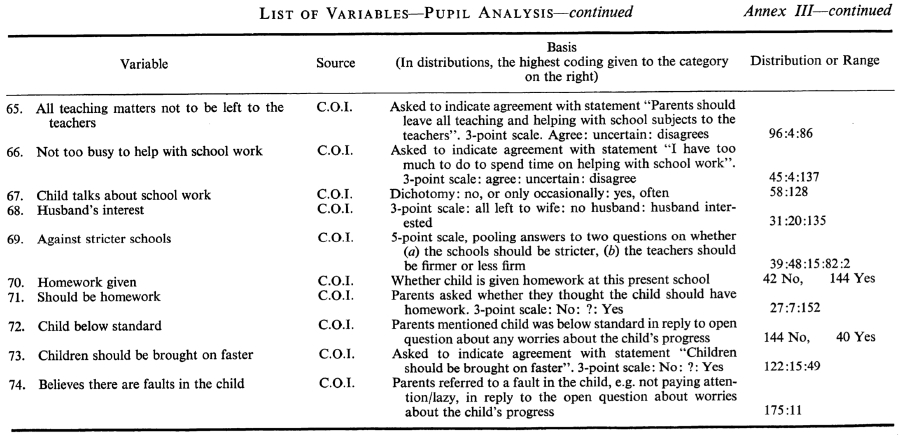
31. The Manchester police, too, were most co-operative in allowing us access to their records. From these, we found out which children in the sample had already been Convicted or Officially Cautioned, and those cases in which another member of the family, or someone living in the same house had a police record. Difficulties arose when someone of a different surname, but with the same address as a child in the sample, had a record, especially a recent record. There was no way of distinguishing between members of the child's immediate family circle (e.g. a foster brother, a stepfather or maternal cousin), lodgers, co-tenants and previous tenants. Hence our variable Criminal Record of House Address probably contains a pretty heterogeneous sample. Carter and Jephcott (1954) in Radby, and research being at present carried out in Wythenshawe, have shown how there can be 'black' and 'white' patches, or even streets, lying cheek by jowl in the same district. As an additional neighbourhood measure we therefore calculated the number of families, in which at least one member had a conviction, living within 50 houses of the home address of each child in our sample (Neighbourhood Crime). A full list of all variables, with their bases of classification, is given in the appendix.
RESULTS
A. CORRELATION ANALYSIS
32. It will be seen that our research had grown to a formidable size by this time. Including the test results (remembering that there are three separate scores for each school for each of the 12 tests) we now had 87 variables. The
[page 357]
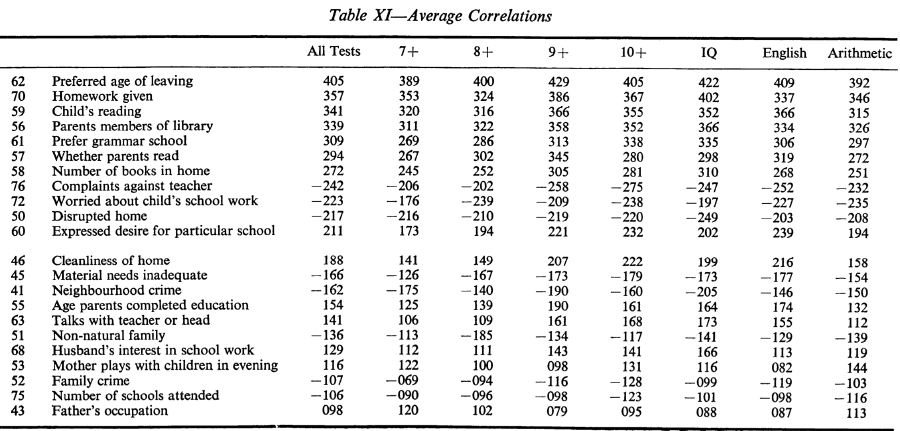
first job was to calculate intercorrelations for the whole matrix. This showed us which of the environmental variables had a significant association with the results of the educational measures. Perhaps the easiest way of summarising the data is to calculate the average correlation of each variable with all the 36 test variables. (This was done ignoring the signs of the correlations, since the signs for backwardness and brightness are in opposite directions.)
Mean correlations
33. The highest correlation (.622), as might have been expected, was with the four year average of 11+ success, but this might reasonably be regarded as a criterion variable rather than an environmental variable. Of the remaining mean correlations, 17 are found to be over 0.3. Ten of these are with neighbourhood variables, seven with school variables. This stronger connection with the social factors in the home and neighbourhood is brought out even more clearly if we average the correlations of all the 18 social variables with the total tests. The result, .295, contrasts with a similar average for the 34 school variables, .212. And if the quasi-criterion variable of 11+ success is omitted, the average school variable correlation drops to .199. It seems as if the forces operating outside the school walls are more pervasive and more powerful than those within.
The table below lists the 17 correlations over 0.3:
Table III
Average correlations of particular environmental variables with the 36 test variables
| Home and neighbourhood | School |
| Verminous children | -.476 | | |
| Cleanliness of home | .475 | | |
| Free meals | -.471 | | |
| Material needs | -.440 | Appearance and sociability | .422 |
| Parental occupation | -.417 | Attendance | .414 |
| Crime (family) | -.378 | Streaming | .385 |
| Free clothing | -.369 | Children qualified for special school | -.360 |
| Children's height | .322 | Class size | .316 |
| Housing standard | .311 | School size | .315 |
| Crime (neighbourhood) | -.303 | Homework | .303 |
34. The emphasis on measures of dirt and of poverty support the results we found in our earlier surveys of secondary school pupils. The inclusion of two crime variables emphasises the importance of the moral and psychological atmosphere of the home and neighbourhood, even at the primary school stage.
35. Our interest, however, is particularly in the school environment. The entries in the right-hand column are headed by Appearance and Sociability, a rating made by our Observer, and one which attempted to disregard socio-economic level. It is, perhaps, a measure which should be thought of as straddling the 'school' and 'neighbourhood' columns: no doubt the school may have some effect here, but the home is almost certainly the major influence.
[page 358]
This variable is closely followed by Attendance (.414) - a logical result, though perhaps some might have expected a higher correlation. Another logical association is that with Children qualified for special schools (.360).
36. The third most powerful association in the school list is one of particular interest, that of Streaming (.385). The direction of the association should be noted: streamed schools have better records of attainment. An average of .385 means that some individual tests have much higher correlations with streaming than this: for example, brightness, 10+ composition, .659, brightness, 10+ arithmetic I, .604; brightness, 9+ English .597. A study of the individual correlations shows that the effect of streaming lies mainly in increasing the proportion of bright children in a school. Of the 10 highest correlations (all over 0.5) seven are with measures of brightness, and three with average score. There is only one correlation greater than 0.4 with the measures of backwardness: 10+ Arithmetic I (-.457). But there is no suggestion that streaming has an adverse effect on the children of low ability: streamed schools tend to have fewer backward children than unstreamed schools at all ages and in all tests. The 12 measures of backwardness have an average correlation of -.237 with streaming, compared with .471 for the measures of brightness.
37. The positive correlations between attainment and class size (.316) and school size (.315) indicate that large schools and large classes are associated with good attainment: a result which supports other researches in this field (e.g. Kemp, and Morris). Many schools were unstreamed merely because of small size. A one-form entry school is almost certain to be an unstreamed school. And in view of the positive correlation between school size and educational attainment, it may well be that the relationship between streaming and attainment is caused by this third factor. A correlation of .655 between streaming and school size is found, emphasising the relationship already mentioned. The size of this coefficient makes it all the more necessary to check on the possibility that our streaming/attainment association is an artefact. We therefore calculated the partial correlation between streaming and the mean results of all the tests at the 10+ age level, holding size of school constant. This analysis reduced the correlation from .464 to .326, but it is still significant, even when the effect of school size is removed.
38. The positive association between educational attainment and size of class is one unlikely to carry conviction with the practising teacher, and may well be that this is an example of the effect, already noted, that bedevils all research of this kind - an artefact of correlation arising from the association of each variable (class size, and educational attainment) with a third more pervasive variable (the socio-economic level of the school neighbourhood). The central area of the city is the area affected by slum clearance, and many of the (small) schools still existing there produce class-size figures much lower than those of the new and larger primary schools in the well-to-do suburbs. In order to investigate this possibility, we calculated some partial correlations, by which means it is possible to eliminate the effect of a third factor. We took the average correlation between all the 10+ tests and class size (.372) and calculated what this would be if the variables of parental occupation were held constant. The correlation dropped, but only slightly, to .317. We then tried again with housing standard partialled out. This produced a slightly greater fall, to .301. Finally we tried free meals, which produced a partial correlation
[page 359]
of .296. It looks, therefore, as though there is a small, but positive, association between size of class and educational attainment. What is abundantly clear is that this variable is much less important than the quality of the home and the standard of the neighbourhood.
39. The final correlation listed in the right hand column of the tables is that of .303 for homework. Schools which give homework (at the 10+ level) tend to produce higher scores in the tests. The pressures for homework in the final school year often come from the middle class parents in the outer suburbs, and it may be that the .303 correlation is merely reflecting the more pervasive social factors. This is unlikely, however, since the r between occupation and homework is only .107. Nor does the partial correlation, holding parental occupation constant, give any support to this theory; no reduction is produced in the correlation between homework and 10+ attainment.
Age-trends
40. So far we have looked at the relationships revealed by a study of the mean correlations over the whole of the 36 educational measures. But these measures cover four age-groups (7, 8, 9 and 10) three types of test (intelligence, English and arithmetic) and three methods of assessment (school mean score, per cent of 'bright' children, and per cent of 'backward' children). These breakdowns enable us to look a little more closely at the effect of environment on attainment. First, let us consider age: what differences appear here? The average correlations rise as the children get older, as will be seen from Table IV. The same trend is shown for both neighbourhood variables and school variables.
Table IV
Average correlations for each year of age
| 7+ | 8+ | 9+ | 10+ |
| All variables | .204 | .231 | .261 | .252 |
| Home and neighbourhood variables | .261 | .275 | .329 | .306 |
| School variables | .174 | .208 | .225 | .224 |
41. Over and above the general trend shown in the table, there are interesting results from some of the individual variables. The greatest increase with age is found with streaming (.17, .39, .39, .46), with school size (.14, .35, .33, .36), with class size (.18, .32, .30, .37) and with homework (.14, .28, .39, .35). What are even more interesting are those school variables which show no increase with age, or even a decrease - such as teacher turnover (.14, .15, .06, .03), school equipment (.21, .20, .14, .13), and proportion of teachers over 50 years of age (.13, .09, .13, .06). Although these correlations are low, the absence of the prevailing age trend might be suggestive.
42. When we turn to the home and neighbourhood variables, those showing a steeper rise than the average are free clothing (.22, .34, .41, .43), per cent of verminous children (.34, .49, .55, .49), and material needs (.34, .40, .51, .48). Thus the effects of poverty and dirt appear to be cumulative. Those variables showing no rise with age are - curiously enough - disrupted homes (.26, .10, .20, .18) and crime-house address (.14, .08, .14, .07).
[page 360]
43. The general tendency for the correlations to rise with age merits a closer examination. There is some doubt as to whether this represents a true picture. It must be remembered that these correlations are between the test results of children who were 10 years of age when the environmental variables were measured, so that the 10+ test results and the other measures are coincident in time. But the 7+ test results are those of these same children three years ago, the 8+ two years ago, and so on. It would not be surprising, therefore, if these correlations have been subject to some degree of shrinkage. If so, the possibility exists that the level of correlation between attainment and environment does not rise with age. It may even fall: our results cannot be used to disprove such a hypothesis. A comparison of our results from primary school with those from secondary schools in 1957, studying pupils of 14+, suggests that this might well be the case. The correlations of attainment with environmental variables all tend to be higher at 10+ than at 14+. Only two of the social variables were identical in the two surveys: per cent of verminous children and per cent in receipt of free shoes and clothing. The average correlations of the former with attainment are .483 at 10+, .383 at 14+. For the latter the figures are .237 and .173. The fall from 10+ to 14+ is apparent for all three types of test, with the change for arithmetic being greater than for English, the smallest change being with the intelligence test.
44. The suggestion that the impact of environmental factors on attainment gets progressively weaker as we go up the age range is supported by other evidence. Furneaux's study of university selection* finds that 'the proportion of those wishing to have a university education who are actually able to apply is much the same for pupils in all occupational groups', and again, 'among pupils who have already reached the upper sixth form, differences of home background are only associated to a very small degree with the strength of the desire for a university education'. Much the same was found by the Robbins Committee. Their Table 7 (Appendix I, Robbins Report) shows that 'within each ability group at 11+, there is no significant difference in performance [at A level] between children from the different [social] classes who stay on'.
Types of test
45. Let us now look at average correlations for the three types of test. Table V shows these for all variables, and also separately for home and neighbourhood variables and school variables.
Table V
Average correlation for each type of test
| Intelligence | English | Arithmetic |
| All variables | .233 | .244 | .210 |
| Home and neighbourhood variables | .314 | .299 | .262 |
| School variables | .190 | .215 | .182 |
46. Over-all, the English tests show a higher mean correlation with the environmental variables than do the intelligence tests or the arithmetic tests.
*The Chosen Few (1961)
[page 361]
When we consider 'home' and 'school' variables separately, however, it is seen that intelligence has a stronger relation with the 'home' variables than the two measures of attainment, and this is in marked contrast to the results for the 'school' variables. The differences shown in the last two lines of Table V may be considered small, but it should be remembered that these are average coefficients (taking due regard of sign) and are based on a considerable number of single correlations. The figure of .190, for example (the mean correlation of IQ with school variables) is derived from 306 separate correlations, while the entry .215 for English is based on 408 coefficients. The mean correlation for IQ with home and neighbourhood variables may be regarded as the least stable of these figures, but even this is derived from 162 separate coefficients, while the 'school' and 'arithmetic' figure is based on no fewer than 510.
47. It is interesting to speculate on the possible reasons for the different emphasis found for the measures of intelligence. Why should lQ be more closely connected with the home and neighbourhood environment? A possible explanation lies in the stronger genetic element in the results from such tests, and the correlation between the intelligence of children and that of their parents. The factors in the environment which affect parents (and which are affected by them) are likely to show more association with children's IQ (correlated with parental IQ) than are those factors which affect children only (i.e. most of the school factors). In other words, the adverse social environment tends to contain more parents with low IQs, whose children tend to have low IQs. When we look at the individual correlations, there is some support for this. The strongest gradient on the IQ, English, Arithmetic line is found for poverty and crime: Neighbourhood crime: .401, .275, .266; Free meals: .544, .491, .410, Family crime: .456, .388, .325. A reversal of this trend is found with the highly individual variable of mother working: .197, .262, .253. Turning to the school variables, the strongest gradient here - in the opposite direction, of course - is found with Streaming: .293, .468, .351, class space: .245, .315, .252 and class size: .272, .363, .305; while a reverse effect is found with Appearance and Sociability: .480, .432, .380 - surely a variable which is closely connected with parental care and upbringing.
Backwardness and Brightness
48. We might look now at the differences revealed between average correlations for backwardness and brightness. It will be remembered that some of the most interesting results from our secondary school survey were related to differences between these measures. Table VI shows the average correlations.
Table VI
Average correlations: Backwardness and Brightness
| Backwardness | Brightness |
| All variables | .195 | .241 |
| Home and neighbourhood variables | .258 | .293 |
| School variables | .161 | .214 |
49. It will be seen that the environment appears to have more effect on brightness than on backwardness, and that this differential is rather more marked with the school variables than with the home and neighbourhood variables.
[page 362]
There are, however, some interesting exceptions to this general trend. Neighbourhood crime correlates .326 with backwardness, only .243 with brightness; Family crime shows the same trend, .394 and ,315. Among the school variables five can be noticed which correlate more highly with backwardness than brightness: Appearance and sociability, .424, .383; Progressiveness (LEA rating), .233, .157; Teachers under 30, .185, .084; Teachers over 50, .108, .021; and Corporal Punishment, .100, .000. Only four variables however (excluding 11+ success) show mean correlations greater than .4 with the measures of backwardness: cleanliness (.443), appearance and sociability (.424), verminous children: .419) and free meals (.415).
In contrast with this there are 10 correlations over .4 with brightness:
|
| Verminous children | -.497 | Streaming | .471 |
| Mother working | -.481 | Attendance | .423 |
| Material needs | -.479 | School size | .413 |
| Free meals | -.475 | Qual. for spec. school | .411 |
| Cleanliness | +.458 | |
| Free clothing | - .413 | |
50. The strong connection with poverty and dirt is clear, as it was in our 1957 survey.
51. It should be emphasised that these results have been obtained from an investigation of schools and not of individual children. Nevertheless, the association between brightness and environmental factors is a particularly important one. The consistency of the findings from three separate surveys in Manchester, together with supporting evidence from Burt and Fraser, point to the virtual certainty that an adverse environment has its greatest educational effects on children of above average ability. If we can discover how to counteract such effects - even partially - then the educational profit will be very large.
B FACTOR ANALYSIS
52. So far we have been looking at correlation coefficients. We have tried, by means of averaging, to see what general trends are discernible. In this research, with 87 variables, there are 3,741 individual correlations to be related to each other. This calls for the drawing of many millions of comparison between pairs of coefficients. Moreover, as we have already become aware in the foregoing section, the degree of correlation between two variables A and B is by no means the only information contained in a correlation table, since A and B may also agree in that they both correlate highly with certain other variables, C, D, E and F, moderately highly with G, H, I and J, not at all with K, L, M and N, and negatively with O, P, Q and R. There are untold millions of complex comparisons to be made, a task beyond human competence. This can be performed, however, by the process of factor analysis, which replaces scores on the 88 variables, which are partly dependent on one another, which are of relatively small statistical importance (variance), and which have low powers of implication and prediction, by scores on a small number of factors, which are completely independent and which have far greater predictive and implicative powers than any of the individual variables. Although other
[page 363]
methods of analysis can be used (and will be used in the later phases of this research) such as the comparison of the mean scores of certain subgroups (analysis of variance), such techniques are much weaker for explanatory purposes, since the investigator himself decides on the crucial 'factors' and no tests of the relative weight (as opposed to the 'significance') of variance factors can be obtained. Nevertheless, in following up results for the more interesting individual variables, the technique of variance analysis and regression analysis should be of considerable value. Its application to scores for the major factors revealed in the factor analysis is an obvious example for its application. To begin with, however, an ordering of such a complex (and relatively unexplored) field by factorial techniques is essential.
53. The Atlas computer produced for us a Principle Components analysis, followed by a Varimax rotation of the first 10 factors. A scrutiny of this showed that six of the 10 factors covered 93.6 per cent of the total variance on the educational tests: the following analysis deals only with these six factors.
Table VII
Percentage variance on the 12 tests contributed by 6 factors
| Factor | I | VII | V | IX | III | X | Total |
| % Variance | 71.8 | 7.9 | 6.6 | 2.6 | 2.5 | 2.2 | 93.6 |
54. As will be seen from Table VII, the first factor is overwhelming in its importance. It covers 72 per cent of the total educational variance, leaving only 22 per cent for the remaining five factors. From a practical point of view, therefore, its effect is all important. From the standpoint of a research worker, however, the patterns revealed in the other five factors are of particular interest, and we must certainly not ignore them. In the remaining sections of this report, however, it must be kept in mind that factor I carries more than three times the weight of all the rest put together.
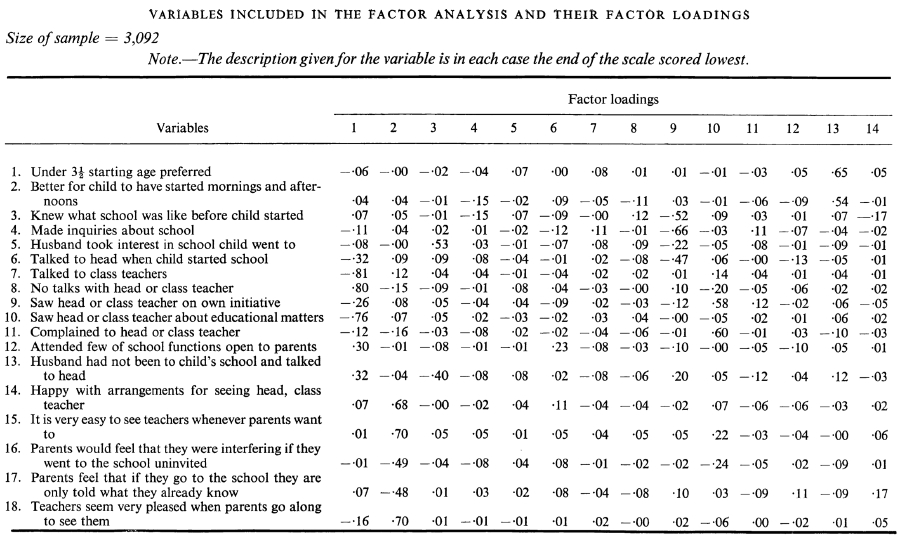
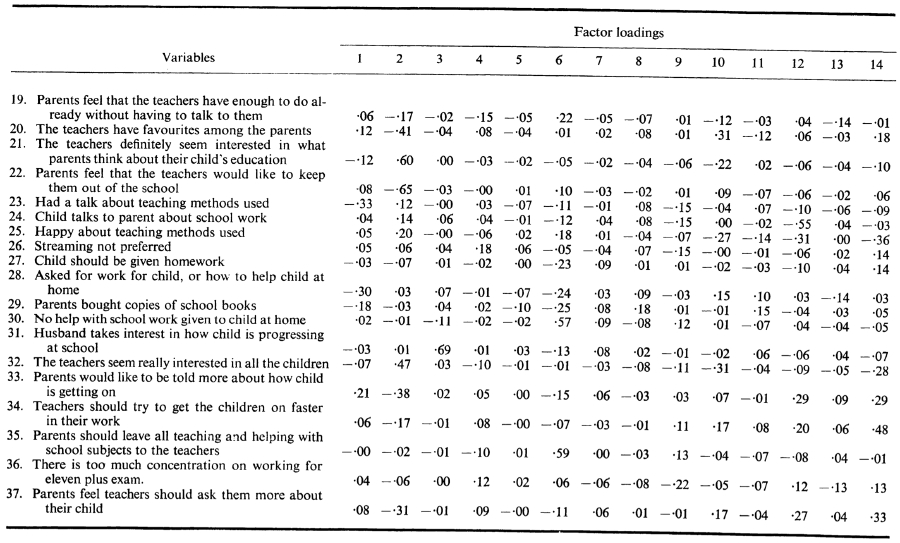
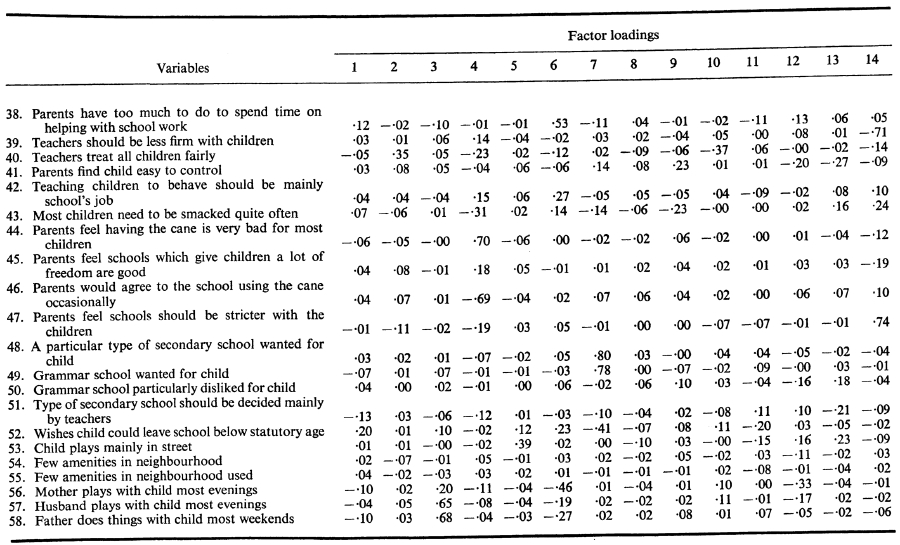
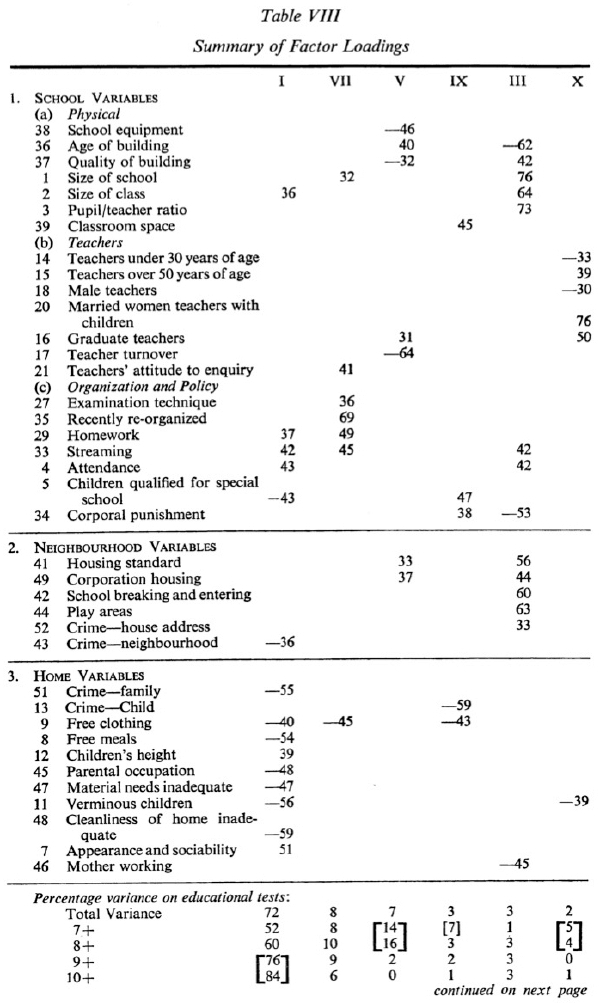
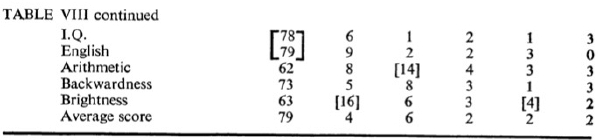
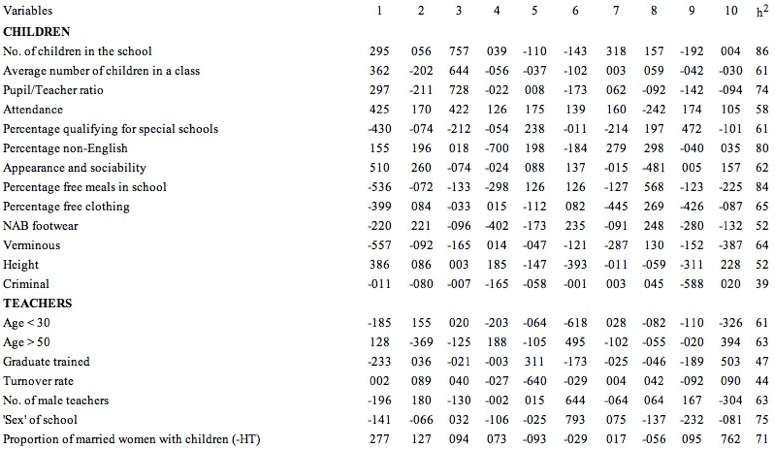
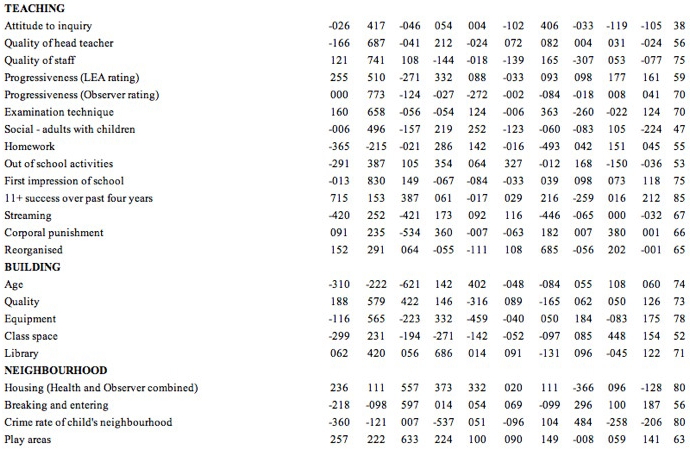
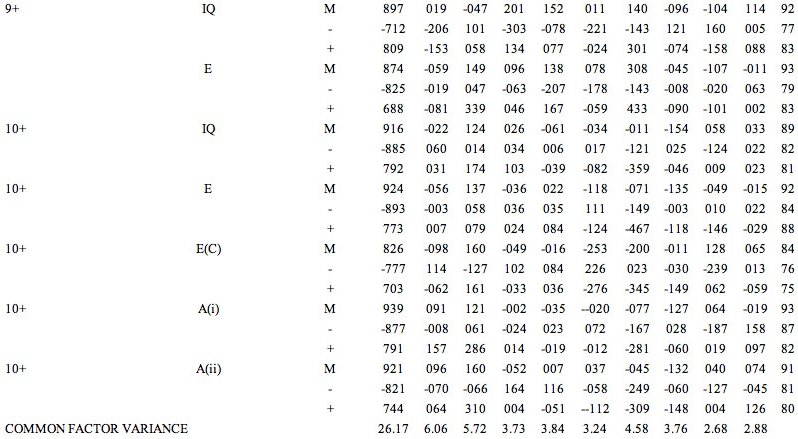
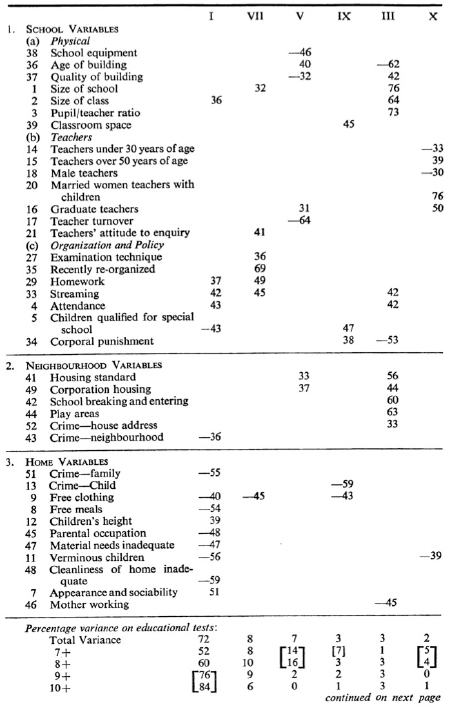
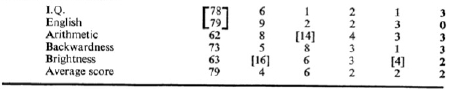
55. A table giving the full Varimax analysis is given in the Appendix. Table VIII* summarises the major loadings on the six factors listed above, and also shows, at the bottom of the table, the way the total 'educational' variance is distributed over age, type of test, and level of performance. One of the interesting things about Table VIII is the absence of some 12 of the environmental variables: absent because they have no sizeable loadings on the six factors which are associated with educational attainment. The absence of some of these may be viewed with some degree of equanimity: variable 6, for example, Mother tongue not English. The maximum incidence of such children in our 44 schools (see Appendix - List of Variables) was 13.6 per cent: a clear indication that this is, as yet, far from a major problem in this city. And the factor analysis shows that this level of incidence has little or no degree of association with level of attainment. It is more surprising, however, to find that 22 Quality of Head Teacher and 23 Quality of Staff have insignificant loadings on the 'attainment' factors. A study of the full Varimax analysis shows these variables with heavy loadings in Factor II: but this contributes only 1.35 per cent to the test variance. Our two measures of Progressiveness
*Variable 32, 11+ success, has been omitted from this table, since we regard this as a criterion variable rather than an environmental one.
[page 364]
Table VIII
Summary of Factor Loadings
 [click on the image for a larger version]
[page 365]
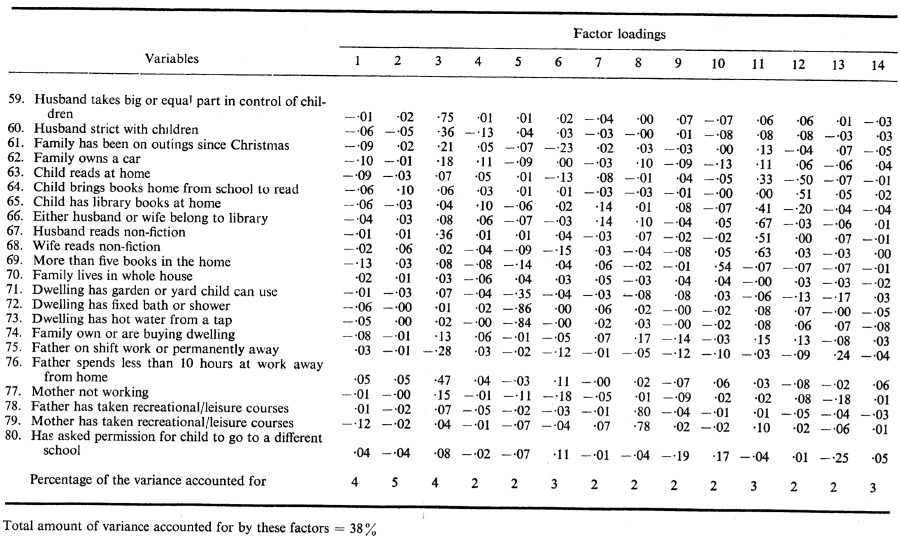
[Table VIII continued]
 [click on the image for a larger version]
(24 and 25) are also missing - and here we have a contrast with our secondary school survey, where Professor Warburton found a significant association between Progressiveness and both reading and arithmetic. The loading of .26 on Factor I is in the right direction, but is disappointingly low.
Factor I
56. Let us now look more closely at the major attainment factor. A glance at Table VIII reveals that the major loadings are concentrated among the Home variables, with the School and the Neighbourhood much less involved. Indeed, if we calculate the amount of 'environmental' variance contributed by each of these categories to Factor I (making appropriate adjustments to take into account the fact that there are different numbers of individual variables in each category) we find that School effects contribute 18 per cent, Neighbourhood effects 20 per cent, and Home effects no less than 62 per cent. This is a finding of the greatest significance, and underlines with considerable emphasis the problem facing the primary school. The adverse forces in the home are, at this stage of education, the overwhelming ones, and the lower loadings (and the fewer loadings) on the school variables suggest that in the present circumstances we are doing little to counteract them by forces within the school. It is surprising to find that none of the teacher variables have loadings over .3 on this factor: the major effect seems to lie in the direction of organisation and policy, with streaming and homework as two of the outstanding variables. Size of class, too, bears out the association already noted in our correlational analysis, with schools with large classes tending to have better standards of attainment than those with small classes.
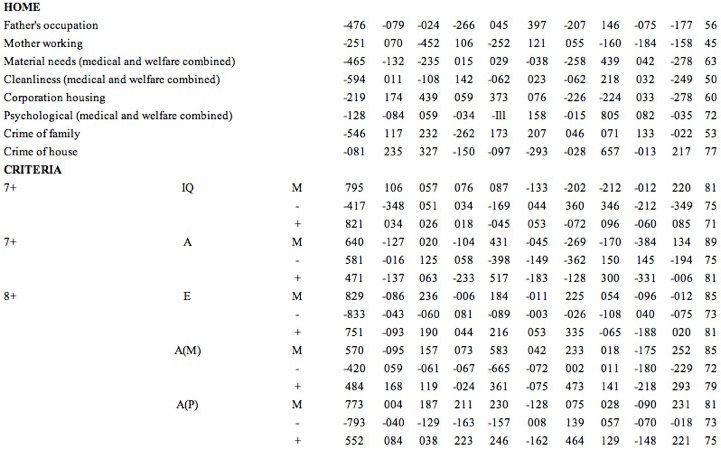
57. When we focus our attention on the crucial sector of Home, we get again the close connection between attainment and both poverty and maternal care. This is seen very clearly if we list the major loadings in order of size:
|
| Cleanliness of home | -.59 |
| Verminous children | -.56 |
| Family crime | -.55 |
| Free meals | -.54 |
| Appearance and sociability of children | .51 |
| Parental occupation | -.48 |
| Material needs inadequate | -.47 |
58. These figures, together with the likelihood (already noted) that the early years bear the heaviest impact of adverse environmental forces, suggest two obvious lines of attack in our efforts to rescue the underprivileged and socially handicapped child from the worst effects of his adverse environment. First there is the provision of nursery schools, so that some educational counter-measures may be applied before the age of five. And such provision is seen not so much to counteract the poor physical environment of the home as to
[page 366]
begin the process of adaptation to the school and the teacher, and with the hope that it might affect the child's attitude towards education. The continued appearance of the maternal care factor suggests that the underlying mechanism may lie in the formation of what McDougall called the 'self-regarding sentiment', with all that this implies for the formation of attitudes towards education and towards authority. If this is so, therapeutic action before the age of five is essential.
59. The second line of attack is to support and encourage a recent new development in the field of teacher training. A few colleges of education have begun to offer courses which include some element of training in social work. The results of this research underline the desirability of increasing the number of such courses. The aim should not be that of trying to produce fully-trained social workers, but rather the training of a proportion of teachers with some knowledge of (and first-hand experience in) adverse environments, with some appreciation of the problems and techniques of social work, and with the attitudes necessary to achieve effective co-operation with social workers and social agencies. If local authorities possessed a teaching force which included, say five per cent of teachers trained in this way, they could expect them to become familiar with the home backgrounds of the children in the most difficult areas, and to engage in liaison work between home and school. The most difficult cases would, of course, be beyond them, but part of their function would be the important one of early referral to more expert and more capable agencies. It may be argued, with some justification, that as yet we do not know enough about the adverse forces and their method of operation to be able to mount such training courses with any degree of certainty about the validity of method and content. But this is being too timid and too conservative. The development of more courses of this kind will assist in the development of new knowledge and new insights, and if they tend to show differences in approach and in organisation this may be all to the good at this developmental stage.
Minor factors
60. As we have emphasised, Factor I is by far the most important, carrying nearly three quarters of the total variance on the educational measures. The other five factors are, however, of considerable theoretical interest, and, as we shall see, the effect of some of them to particular directions is far from negligible.
61. Let us look first at the partitioning of the 'educational' variance shown at the foot of Table VIII. Factor VII is clearly one which is important for Brightness, and Factor III supports this in a smaller degree. Between them they account for 20 per cent of the Brightness variance. Factors V and X (and IX to some extent) have their greatest effect at the 7+ and 8+ ages, with Factor V concentrating very heavily on Arithmetic.
62. The age pattern is of particular interest. Quite clearly the pattern of abilities changes radically between the age of 7 and 10. Notice how only 52 per cent of the 7+ variance is covered by the major Factor I. Environmental forces appear to be much more complicated at the earlier ages.
[page 367]
63. The summary at the foot of Table VIII shows the way the educational variance is spread over the six factors. We can do an equivalent analysis on the environmental variance. It is a little more complicated because of the difference in the number of individual variables in the categories School, Neighbourhood and Home. But if we adjust for this, and if we take the total environmental variance on these six factors only as being 100 per cent, we arrive at Table IX. A comparison of this with the breakdown of educational variance shown in Table VIII is most interesting. Notice how Factor I, with its lion's share of educational variance, is now overshadowed by Factor III. The other four factors are all about the same level of weighting, nine per cent or 10 per cent each. The side totals show roughly equal contributions by school, neighbourhood and home (but notice that that the school is lowest of the three) although individual factors show very obvious differences here.
Table IX
Percentage allocation of environmental variance among six factors
| Factor | I | VII | V | IX | III | X | Total |
| School variables | 4.9 | 4.1 | 4.4 | 2.8 | 10.3 | 4.4 | 30.9 |
| Neighbourhood variables | 5.4 | 1.6 | 4.2 | 1.4 | 20.9 | 2.5 | 35.9 |
| Home variables | 16.8 | 3.0 | 1.4 | 5.7 | 2.7 | 3.5 | 33.2 |
| TOTAL | 27.1 | 8.7 | 10.0 | 9.9 | 33.9 | 10.4 | 100.0 |
64. If we consider the top line of the table, we may analyse a little further, by breaking down the variance on the School variables into the three divisions already employed in the upper part of Table VIII. This breakdown is shown in Table X.
Table X
Percentage allocation of variance on the School Variables among six factors
| I | VII | V | IX | III | X | Total |
| (a) Physical | 7 | 2 | 6 | 4 | 27 | 1 | 47 |
| (b) Teachers | 3 | 2 | 5 | 2 | 1 | 12 | 25 |
| (c) Organisation and policy | 6 | 9 | 3 | 4 | 6 | 1 | 29 |
| TOTAL | 16 | 13 | 14 | 10 | 34 | 14 | 101 |
65. We see from the right hand totals that the physical aspects of the school environment have a much greater importance than either the teachers or the organisation and policy, and that this effect is concentrated very heavily in Factor III. Factor X is the one which is almost entirely concerned with teachers - and this, it will be remembered, contributes only two per cent of the variance on the educational tests, although it is significant that its effects are concentrated on the younger children.
Factors associated with age
66. Table VIII shows us that Factors V, IX and X have much stronger effects at 7+ and 8+ than at the upper end of the primary school. Factor V has its
[page 368]
heaviest loading in 17 teacher turnover rate. Indeed, this is the only factor out of the 10 which shows any connection with this variable. And it is logically sensible that high rates of teacher turnover are particularly deleterious to the younger children (and particularly important for attainment in arithmetic). It is, however, a little surprising that the ten year olds seem almost completely unaffected by this. Other 'school' loadings on Factor V are for 38 School equipment, 36 Age of building (both in the 'wrong' direction, curiously enough), 37 Quality of building and 16 proportion of Graduate Teachers. This last is particularly interesting, since it is supported by Factor X (also 'young children' factor) and is in contrast to Factor I where a lowish loading on this variable is negative. Why should graduate teachers in primary schools have a positive effect at the lower end of the age range, and a negative effect at the upper? Many people would believe that, if any such differential existed, it would be in the reverse direction. The presence of married women graduates, with young children of their own, may have a bearing on this.
67. Factor X is almost entirely a 'teacher' factor, and from this it will be seen that attainment at the 7+ and 8+ levels is associated with older rather than younger teachers, with women teachers rather than with men teachers, and that the heaviest loading of all is for the proportion of married women teachers with children of their own. It is heartening to find reasons additional to mere teacher shortage for this return to the profession. The third factor associated with young children (Factor IX) has only one loading of particular note, that of 39, Classroom space. It is interesting to find this associated positively with test attainment.
Factors associated with 'brightness'
68. Factors VII and III show particular associations with high scores on the tests. A study of the major loadings show that newer schools, larger schools and larger classes tend to have higher proportions of bright children, while streaming and the existence of homework are also positive factors. Neighbourhood variables involved include housing standard and play areas, with oddly perverse signs for crime (house address) and school breaking and entering. Of the 'home' variables the only sizeable loadings are free meals (-.45) and mother working (-.45).
SUMMARY
69. This report has been concerned with the statistics related to 44 schools, their environment, and the environment of their children. The unit of analysis has been the school, and not the individual child, and it is necessary to keep this in mind when we survey the results of our labours.
70. We have analysed the inter-correlations of 87 separate variables, 36 of them scores on tests, at four stages, and 51 of them measures of the children's environment, school, neighbourhood and home. Our analysis has first been done by means of average correlations, and then, more comprehensively, by factor analysis.
71. The most important of our findings, perhaps, is the demonstration that the major forces associated with educational attainment are to be found
[page 369]
within the home circumstances of the children. These 'home' variables have, pro rata, nearly twice the weight of 'neighbourhood' and 'school' variables put together. That this may - at least partially - be caused by our choice of variables, and that a different selection might upset this order of influence, is a valid argument. But a scrutiny of the categories of measurement would suggest that our results might underestimate the power of the home. We endeavoured to cover all aspects of the school environment in our survey, taking account of not only those matters which are capable of objective measurement such as school size, pupil/teacher ratio, and the age distribution of teachers, but also of those aspects of school life which are matters of judgement rather than matters of counting: variables such as progressiveness, social atmosphere, quality of building, of equipment and of staff. Estimates of such matters are subject to error and are far from the level of reliability that can be attached to measures such as the age of the school building, or the proportion of men teachers on the staff. The factor analysis demonstrates, however, that the element of unreliability was not so great as to swamp the element of valid judgement. Our school variables, therefore, are many and varied, covering children, teachers, equipment and structure and it is difficult to believe that we have omitted any set of variables that would show a significantly stronger relationship with attainment. Our measures of the home and of the neighbourhood, on the other hand, are relatively few in number and limited in scope. It is not impossible that a more comprehensive coverage would have the effect of increasing the average effect of 'home' as against 'school'.
72. The aspects of home background that have the strongest associations with attainment on the tests seem to be those measures of maternal care which we have previously found so powerful in their association with the attainment of children in secondary schools. Such variables, together with those associated with material need, make up most of the 'home' effect. But dirt and crime seem more important than poverty in this context.
73. The second fundamental result of our researches, and one of the utmost significance, is the demonstration that the effects of environment seem to press more heavily on the brightest of the children. The adverse elements in home, neighbourhood and school conditions are shown to reduce the proportion of able children in the schools. This finding, which has some support from other inquiries, is of the greatest significance for educationists, for politicians, and for society as a whole. When we think of the problem of material and cultural deprivation, we see it as a problem affecting the 'submerged tenth' the slum dwellers, the poverty-stricken. We tend to assume that it affects only the tail end of the ability range as well as the tail end of the income range. Both of these views are wrong, and the second is even more radically wrong than the first. Educational deprivation is not mainly the effect of poverty: parental attitude and maternal care are more important than the level of material needs. The child from a home with an income of £20 per week may be more at risk than one from a much poorer home. The assumption that educational deprivation breeds educational backwardness is true but misleading. What is more in accord with the facts is the dictum that educational deprivation prevents the flowering of latent abilities, and that the higher the potential, the more potent and the more catastrophic is its effects.
[page 370]
74. It seems possible that environmental effects are strongest at the lower end of the school, and tend to fall off in their impact on educational attainment as the children get older. We cannot be categorical about this, since the design of this research is incapable of demonstrating it unequivocally. But our results provide some support for such an hypothesis. This would suggest that the provision of nursery schools ought to be seen as a way of counteracting adverse home conditions at the earliest possible moment - and counteracting adverse intellectual and attitudinal factors rather than the merely physical. This is the point at which the battle should first be joined: and the battle for the bright as well as for the dull.
75. When we survey the results of our investigations of the school environment we find the surprising result that organisational and physical aspects have stronger associations with the criterion tests than have the teacher variables and those associated with school atmosphere. The major factor, covering nearly three quarters of the total test variance, contains only five 'school' variables with loadings over 0.3 - and of these, attendance can clearly be regarded as one at least partially (and perhaps mainly) mediated by the home and the parents. A second one - the proportion of children qualified for special school - can hardly be regarded as a measure over which the primary school has much control: it is mainly a measure of one aspect of the quality of the school's intake. These leave us with only three significant variables; streaming, homework and size of class.
76. Little emphasis ought to be placed on the positive relationship between streamed schools and test performance, for two reasons. First, we are dealing with a relatively small sample of schools - 44 only, of which 28 are one-form entry. An unstreamed school in this survey is not unstreamed because of a policy decision on the part of the head teacher, but because it cannot be anything else! It is true that seven of these 28 were categorised as 'streamed' by our Observer, on the grounds that the age-groups were mixed and the children were grouped on ability, but there was no evidence that the remaining 21 were possessed of a 'non-streaming ethos'. Secondly, it is necessary to emphasise again the limitations of our criterion measures. The tests given at 10+ were those used by the authority for secondary school selection: those at the earlier ages were of a similar type. These objective measures of the tool subjects are those which might be expected to benefit most from the formal methods of teaching which tend to accompany streaming. But this should not blind us to the possibility that other kinds of assessment might produce the reverse effect. 'Progressive' methods and 'activity' methods are designed to do more than produce skill and competence in the three Rs: the advocates of non-streaming tend to be those who argue for less formal teaching and a wider curriculum. The fact that we perforce had to use objective tests of English, Arithmetic and Verbal Intelligence as our criteria means that we have left untapped wide areas of primary school achievement, and have loaded the scales against more progressive methods of teaching and organisation. It is unfortunate that the controversy about streaming has become a major politico-educational issue. It is an extremely complex matter to investigate, and it would be folly to suggest that the results from 44 schools in a single authority can throw any but the most feeble gleam of light on this problem. It is suggested that the only fact of any significance in our results may well be
[page 371]
the demonstration that, even using objectives tests of limited coverage, streaming does not produce adverse effects at the lower end of the ability range. As we said earlier, streamed schools tend to have fewer backward children than unstreamed schools at all ages and in all tests.
77. The positive association of homework with attainment must also be related to the nature of our criterion measures. We have shown, by using the technique of partial correlation, that this is unlikely to be the result of parental pressures from the middle-class homes: it would seem more likely to be a school reaction to the pressures of 11+ selection.
78. The factor loading of .36 with size of class brings this research into line with many others which have shown a similar relationship. Our data show that this is partly - but only partly - a function of school size and quality of neighbourhood (in a city where many of the smallest primary schools are in the worst areas, awaiting demolition).
79. The less important factors thrown up in the factor analysis provide some interesting results, particularly for the younger children of 7+ and 8+. Teacher turnover rate is shown to be particularly important here, as well as the presence of older teachers, of women teachers, and of married women teachers with children.
80. All in all, it is clear that our schools analysis has raised a number of questions rather than produced solutions to problems. This is to be expected in a field which has been so neglected in research. The limitations of correlational analysis are many, and it must be remembered that the figures we have presented here are measures of association: they are not (necessarily) indications of causality. And the special nature of a research using schools as units must be remembered: correlations between schools cannot be used as substitutes for - or assumed to be equal to - correlations between individual pupils. The second stage of our inquiry becomes important, therefore, not only for the intrinsic value of its results, but for the relationship shown (if any) between the school analysis and the pupil analysis.
II THE PUPIL ANALYSIS
81. The sub-sample of individual pupils for this part of the inquiry was drawn from 22 schools. From each of the sampled schools 10 children were chosen, using a table of random numbers. By the same method, two children were chosen as reserves. The parents of 191 children in the original sample were interviewed. Three children had left the school, and in 12 further cases no contact could be established, either because the family had moved (sometimes because of slum clearance), or were on holiday, or because the parents were reported by neighbours to be always out, or (in one case only) because the address given was non-existent. Thirteen parents refused to be interviewed. Three of these 'had no time to spare', and a fourth was ill. Of the rest, only four refused outright, the other six made appointments but later broke them. In addition, one interview was abandoned because of the Pakistani parents' lack of English. Nineteen of the non-respondents were replaced by reserves, so that there were in all 210 interviews.
[page 372]
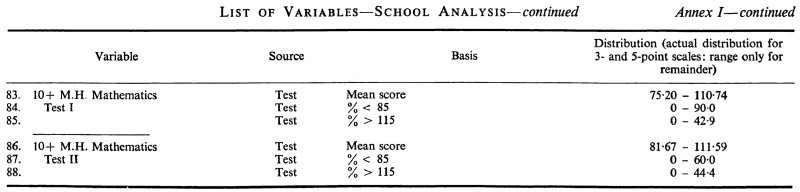
82. Further wastage occurred because of lack of complete data on the criterion tests. If a child in the sample had missed only one or, at the most, two of the twelve tests used as criterion measures, or if the school specifically stated that he had not taken one or more of the 10+ (selection) tests for reasons of backwardness (and provided that he had taken all the earlier tests), the missing scores were inserted by calculating the child's average score for the appropriate type of test (English, Arithmetic, Intelligence). For 24 children the omissions were more frequent and they were excluded from the analysis. This report is thus concerned with the results from 186 children and their parents.
Variables
83. The criterion variables were, of course, the results of the 12 tests of intelligence, English and arithmetic given at 7+, 8+, 9+ and 10+. There were also a number of the home and school variables used in the schools analysis that were applicable to individual children: Head teachers' rating, Material needs inadequate, Cleanliness of home, Disrupted homes, Family crime, Neighbourhood crime.
84. In selecting those responses to the COI questionnaire which should be quantified and used in the analysis, we had the benefit of a factor analysis of the questionnaire items. Using this as a guide, a first selection was made of 53 items. Some of these were closely related, e.g. Type of house and Council house; Talks with teacher and Whether discussed child's progress with teacher; Complained at school and Dissatisfaction with teachers. These were included in the correlation matrix, and exclusion decided upon in the light of the size of the correlation coefficients. This scrutiny led to the dropping of 13 variables, most because of overlap (as above) but some because of lack of correlation with the criterion variables. For example, Sex of child had an average correlation of .041 with the educational tests, Availability of children's clubs .034, Mother working -.051, No garden -.091, Husband lenient with child -.062, Parents' belief in corporal punishment .038, Age child started school .048.
85. Since we had obtained interesting results on backwardness and brightness in the school analysis, we were anxious to include similar measures for the individual study. This is not so simple, however. For a school, the percentage of children scoring over 115 or under 85 is a statistic which produces a graduated scale of measurement over a sample of schools: for an individual child his score on any particular test either is or is not outside one or other of these arbitrary limits. There are a number of ways in which the association between brightness or backwardness and social factors may be assessed in a sample of children: we finally decided to use a simple dichotomy (bright, not bright; backward, not backward) as a scoring device for each child on each test. Since the correlations between these measures themselves, and between them and the actual test score will inevitably be high, it was judged safest to perform three separate factor analyses: the first using actual test scores as criterion variables, the second using the bright: not bright dichotomies as the criteria, the third using backward: not backward. For each analysis we thus had 52 variables, 12 criterion measures and 40 'family' measures. The results of the three factor analyses are treated separately below. The annex contains a list of the variables involved, together with a description of their bases and a note of distribution or range.
[page 373]
A. TEST SCORE ANALYSIS
Average correlations
86. Table XI shows, in the upper half, all the variables having an average correlation with the 12 tests of over .2. The lower half of the table includes a selection of the remaining variables: it is not comprehensive, and it must not be assumed that because a variable is not included here its average correlation is lower than that of the bottom entry.
87. The highest correlation of all is given by 62 Preferred age of leaving, a six-point scale ranging from 'under 15 if possible' up to '18+'. This is perhaps the sharpest and quickest way of indicating parental attitude towards education. The superiority of the IQ correlation (.422) over that of English (.409) and Arithmetic (.392) tends to support the view put forward in the earlier part of this Report of the importance of the genetic element. The second variable in the list (70 Homework given) is the response to the question 'Have the teachers at .... school given the child any work to do at home?' This should not be regarded as necessarily a school variable. A negative response may indicate parental ignorance and lack of interest - or, indeed, the child's refusal to conform.
88. What is very significant is the presence in the 'top seven' of the four variables dealing with reading, with average correlations with all tests ranging from .272 to .341, and an overall average of .312. Compare this with the bottom line of Table II: Father's occupation .098. Although there is some slight association with social class, what matters is the degree of literacy within the home, and the attitude of parents towards books and towards school. These correlations emphasise the existence of many 'good' homes in the working class, and many 'bad' homes in the middle class. The differences between the three kinds of test are also interesting for the reading variables. The child's reading understandably shows the highest correlation with the English tests: if we average the correlations of the other three reading variables we get IQ .325, English .307 and Arithmetic .283. It is not unreasonable to assume that the standard of literacy in the home, and the interest the parents show in reading, are - like their readiness to keep the child at school beyond the statutory leaving age - correlated with the parents' level of intelligence. Indeed, one would expect a strong association here. It is not surprising therefore, to find a high correlation of these variables with the level of intelligence of the child. As in the schools analysis, variables which are parent-determined, or which are likely to be affected by parental action or attitude, tend to show higher correlations with the child's IQ than with the measure of attainment.
Age trends
89. There is a general tendency, as in the schools analysis, for coefficients to rise with age; but, as we pointed out, this may not be significant. There are indications, however, of variables which seem to have stronger associations with the attainment of the younger children. The easiest way to pick these out is to run the eye down the 7+ column, noticing any figures which breaks the order of size. Four variables stand out in this respect: Disrupted home, Neighbourhood crime, Mother plays with children in the evening and - rather oddly
[page 374]
Table XI
Average Correlations
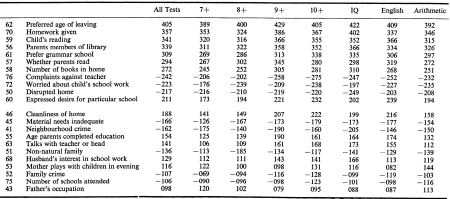 [click on the image for a larger version]
[page 375]
- Father's occupation. Disrupted home and Mother's play are logically enough the kinds of factors very likely to have major impact on the youngest children but it is puzzling to see why Neighbourhood crime should show this tendency when Family crime does not. The result for Father's occupation seems to have little relation to economic factors, since Material needs inadequate shows no similar trend (7+, -.126; 8+, -.167; 9+, -.173; 10+, -.179).
Factor Analysis
90. A principal components analysis was carried out followed by a Varimax rotation of 17 factors. When the variance contributed by the educational tests to these factors was calculated, it was found that 94.2 per cent of this variance lay in the first factor: none of the other factors contributed more than 0.7 per cent. We have, therefore, a simple and uncomplicated solution.
91. The major loadings on the only (educationally) significant factor are given on Table XII. It will be seen that - as we would expect from a mono-factor solution - it bears a close resemblance to the average correlation data in Table XI. The heaviest loadings are for those variables indicating parental attitude towards education and the literacy of the home. Good attainment is achieved by pupils with parents who want them to stay on at school beyond 16, who prefer a grammar school education, who are members of a public library, who possess books themselves, and who tend to read both fiction and non-fiction. Poor attainment is shown by children whose parents are worried about teaching methods or the child's school progress, who are critical of the
Table XII
Major loadings on Factor I - Test Score analysis
| 62 Preferred age of leaving | 0.437 |
| 59 Child's reading | 0.433 |
| 70 Homework given | 0.379 |
| 61 Parents prefer grammar school | 0.356 |
| 56 Parents members of library | 0.343 |
| 57 Whether parents read | 0.325 |
| 58 No. of books in home | 0.282 |
| 72 Worried about child's school work | -0.273 |
| 76 Complaints against teacher | -0.247 |
| 50 Disrupted home | -0.205 |
| 40 Discussed problem behaviour at school | -0.204 |
| 60 Expressed desire for particular school | 0.201 |
| 42 Facilities for neighbourhood play | -0.197 |
| 41 Neighbourhood crime | -0.181 |
| 73 Children should be brought on faster | -0.157 |
| 39 Difficult to control at home | -0.155 |
| 48 Bedroom deficiency | -0.151 |
| 46 Cleanliness of home | 0.145 |
| 49 No fixed bath | -0.141 |
| 47 Type of house | -0.132 |
| 55 Age parents completed education | 0.129 |
| Average test variance on Factor I: |
| 7+ | .688 |
| 8+ | .783 |
| 9+ | .819 |
| 10+ | .794 |
| IQ | .814 |
| Eng. | .765 |
| Arith. | .766 |
| Total | .778 |
[page 376]
child's teachers, who have visited the school to discuss the child's behavioural problems, and who believe that teachers should try to get children on faster in their work. The psychological aspects of the home (e.g. disruption, child difficult to control) tend to be more important than the physical environment (e.g. bedroom deficiency, no fixed bath, cleanliness, type of house). It is, perhaps, surprising to find a relatively low loading on 55 Age parents completed education: this, perhaps, does not argue a great deal of success for the educational system. Those of us who chafe at what often seems the impossibility of achieving radical change quickly - and this is undoubtedly the case for the problem of environmental handicap - sometimes try to comfort ourselves with the belief that, with succeeding generations, education itself will provide the remedy. We get small comfort from this analysis. Education beyond the statutory leaving age seems, in this sample, to have comparatively little effect on attitude towards the education of their own children. It correlates only .210 with Preferred age of leaving and .123 with Grammar school preferred. Even with the literacy variables the correlations are low: Parent's reading .215, Membership of library .208 and Books in home .129. On the other hand, our sample of parents is probably less than fully representative here. The distribution of ratings on variables 55 shows that, of 186 families, in 132 both mother and father left school at 14 (or earlier) and in 28 further cases one parent left at 14 and one at 15. This perhaps may serve to underline one of the problems of interpretation of inquiries such as this: the possibility that certain results reflect the circumstances of a particular region, and cannot be generalised to the country as a whole. The hazards of applying results obtained in large cities to country towns or villages are obvious: there may be equal hazards in generalising from the North to the South, in view of what we know of the social and educational gradient existing in Britain.
92. Age-trends and test-trends are shown at the bottom of Table XII, from which it can be seen that this factor has its strongest loadings on the educational measures at the age of 9+, and that its connection with general ability is clearly stronger than with English or Arithmetic.
B. BRIGHTNESS ANALYSIS
93. The computer programme identified 17 factors from the principal components analysis for Varimax rotation. Of the total educational variance contributed by these factors, 76 per cent came from Factor I. The next highest fraction was from Factor 12, but since this was only 5.1 per cent, its influence is of little account. We are therefore left with another single factor analysis. The major loadings on this first factor are given in Table XIII.
94. There are considerable similarities in this pattern and the one for the score analysis. The four measures of home literacy are again found among the top seven variables, for example. But the primacy of 62 Preferred age of leaving yields place to 61 Grammar school preference. This is perhaps a sharper measure of parental attitude for the above-average child than the wider-ranging 62. What is of most interest perhaps is the collection of variables which appear in this table but which were not included in the 21 measures having the strongest loadings in the score analysis: 68 Husband's interest, 75 Changes of school, 45 Material needs inadequate, and 63 Talks with head or
[page 377]
Table XIII
Major loadings on Factor I - Brightness analysis
| 61 Grammar school preference | .407 |
| 56 Membership of library | .360 |
| 59 Child's reading | .283 |
| 57 Parent's reading | .279 |
| 62 Preferred age of leaving | .258 |
| 68 Husband's interest | .223 |
| 58 Books in house | .219 |
| 72 Child below standard | -.208 |
| 75 Changes of school | -.200 |
| 70 Homework given | .184 |
| 76 Dissatisfaction with teacher | -.182 |
| 42 Facilities for play | -.167 |
| 60 Secondary school preference | .163 |
| 41 Neighbourhood crime | -.153 |
| 45 Material needs inadequate | -.153 |
| 63 Talks with head or class teacher | .146 |
| 73 Children shodd be brought on faster | -.145 |
| 50 Disrupted home | .138 |
| 46 Cleanliness of home below standard | -.128 |
| 39 Difficult to control at home | -.123 |
| Average test variance on Factor: |
| 7+ | .286 |
| 8+ | .529 |
| 9+ | .635 |
| 10+ | .608 |
| IQ | .587 |
| Eng. | .619 |
| Arith. | .448 |
| Total | .539 |
class teacher. In contrast to these, there are five variables included in the previous list which find no place here: 40 Discussed problem behaviour at school, 55 Age parents completed education, 47 Type of house, 48 Bedroom deficiency, and 49 No fixed bath. It seems, therefore, that although poverty might exercise an inhibiting effect on the emergence of brightness, the purely physical aspects of the home environment are relatively unimportant. The interest of the child's father in school work, however, is markedly associated with brightness, as well as evidence of parental interest as shown by discussions with the school staff - provided, however, that these are sharply distinguished from those visits made to discuss unsatisfactory progress. The low loading on 55 Age parents completed education remarked on in the discussion of the score analysis is paralleled by an even lower loading on the brightness factor (.061 as compared with .129).
95. The bottom of Table XIII shows the age-trends and test-trends for the factor. As in the score analysis, 9+ shows the highest proportion of variance, but is not markedly higher than 10+. The major difference lies in the much lower contribution from the 7+ tests in the brightness analysis. This is made even clearer if the figures are expressed as ratios. Taking the 9+ variance as 100 in each case, the 7+, 8+ and 10+ contributions are, for the test score analysis, respectively 84, 96 and 97. For brightness, they are 45, 83 and 95. This indicates, perhaps, more radical changes in level of attainment over the years for those children at the upper end of the ability range, thus emphasising again the greater environmental risk for the bright child.
[page 378]
96. For test score, IQ contributed more to Factor I than either English or Arithmetic. Expressed as ratios, the variances are 100: 94: 94. The picture for brightness is different, with English showing up strongly, and Arithmetic much lower: 100: 105: 76. Other investigators have stressed the importance of verbal ability and its susceptibility to environmental influences. These results suggest that they may be rather more important at the upper end of the ability range than with the average child.
C. BACKWARDNESS ANALYSIS
97. The backwardness analysis was a replication of that done for brightness. The computer rotated 18 factors to a Varimax solution. The first factor covered 73 per cent of the test variance, but on this occasion a second factor proved to have a sizeable weighting: Factor 16, contributing 11.7 per cent of the variance on the educational tests. It has only one sixth of the power of Factor I, but its influence is obviously not negligible.
The first factor
98. Loadings of .100 and over on this factor are shown in Table XIV. A fuller comparison of this table with the corresponding tables for the other analysis is made later, but certain obvious points may be noted. First, the four 'home literacy' variables again appear in the top half of the table, but with slightly less importance. The average rank order of these four measures are four for brightness, five for score, and six for backwardness. 70 Homework given goes to the top here, in contrast to its rank of 3rd for score and 10th for
Table XIV
Major loadings on Factor I - Backwardness analysis
| 70 Homework given | .320 |
| 62 Preferred age of leaving | .292 |
| 59 Child's reading | .289 |
| 40 Discussed problem behaviour at school | -.226 |
| 57 Parents' reading | .219 |
| 72 Child below standard | -.218 |
| 58 Books in house | .209 |
| 50 Disrupted home | -.159 |
| 56 Membership of library | .144 |
| 41 Neighbourhood crime | .143 |
| 76 Dissatisfaction with teacher | -.143 |
| 60 Secondary school preference | .123 |
| 67 Child talks about school work | .120 |
| 46 Cleanliness of home inadequate | -.116 |
| 66 Mother not too busy to help with school work | .109 |
| 49 No fixed bath | -.107 |
| 61 Grammar school preference | .102 |
| 55 Age parents completed education | .100 |
| Average test variance on Factor: |
| 7+ | .285 |
| 8+ | .631 |
| 9+ | .650 |
| 10+ | .542 |
| IQ | .456 |
| Eng. | .655 |
| Arith. | .498 |
| Total | .540 |
[page 379]
brightness. Of the direct parental attitude measures, 62 Preferred age of leaving parallels the score analysis as being the most important, 61 Grammar school preference coming 17th here as compared with first for the brightness analysis.
Only two variables appear in this table and not in the other two: 67 Child talks about school work and 66 Mother not too busy to help with school work. Thus it seems that parental attitude towards the child, and support for him in his educational difficulties, are of some importance in the prevention of backwardness. But note that this falls well below home literacy and attitude towards education in the order of importance.
Factor 16
Table XV
Major loadings on Factor 16 - Backwardness analysis
| 53 Mother spends time with child in evenings | .512 |
| 43 Father's occupation | -.238 |
| 65 All teaching matters not to be left to the teacher | .180 |
| 75 Changes of school | -.163 |
| 59 Child's reading | .147 |
| 67 Child talks about school work | .136 |
| 54 Parents' further education | .113 |
| 46 Cleanliness of home inadequate | .113 |
| 45 Material needs inadequate | .103 |
| Average test variance on Factor: |
| 7+ | .251 |
| 8+ | .054 |
| 9+ | .006 |
| 10+ | .070 |
| IQ | .086 |
| Eng. | .020 |
| Arith. | .138 |
| Total | .086 |
99. A glance at the bottom section of Table XV makes it clear that this factor reflects associations only at 7+, and only with Arithmetic. Notice, however, that the average 7+ variance of .251 is commensurate with the 7+ variance of .285 on Factor I: for these young children, both factors are of equal importance.
The variables represented in Table XV tend to support the last comment made about the first factor, and to underline the importance of parental attitude to the child. Variable 53 has a loading more than twice as great as any other measure, and is clearly the 'marker variable' for this factor. It plays no part in the constellation of variables making up the first factors in our three analyses: the loadings on 53 Mother spends time with the child in the evenings are .120 (score), .046 (brightness) and .073 (backwardness). We now see, however, that this aspect of maternal attitude and behaviour has some relevance to backwardness, but only with reference to the youngest age group.
100. The second variable, 43 Father's occupation, also appears for the first time as a significant variable. Its loadings on the three first factors are -.077 (score), -.104 (brightness) and .078 (backwardness). The perverse sign in the last entry is probably of no significance, since the loading is not significantly different from zero. The uniformly low loadings in this variable, so often used by sociologists, re-emphasises the importance of intra-class differences in background and parental attitude as compared with inter-class differences.
[page 380]
101. Of the other measures included in Table XV, 65 and 67 tend to support the maternal attitude aspect of this variable, while the deleterious effect on the young pupil of changes of school is again drawn to our notice. That this factor is concerned almost entirely with backwardness in arithmetic will not escape notice: the effect of changes of school is very likely to show itself in performance in such a logical subject as this.
D. THE THREE ANALYSES COMPARED
102. We have here three separate analyses, each yielding a single factor contributing three quarters or more to the total test variance. What are the similarities and differences in the factor patterns? Does this investigation of 186 children show differences between backwardness and brightness similar to those yielded by the investigation of 44 schools?
Similarities
103. Let us begin by considering the common elements in all three analyses. In order to avoid making what might be misleading comparisons between the actual size of loadings, we shall pay most attention to rank order of importance of variables. If we take - arbitrarily - the 'top ten' loadings in each of the first factors, what are the variables which appear in all three analyses? The variables are these, the major common elements:
56 Membership of library
57 Parents' reading
58 Books in house
59 Child's reading
62 Preferred age of leaving
70 Homework given
72 Child below standard
104. Here we have a clear indication of the importance of home literacy (56-59) and parental attitude towards education (62, 72). The homework variable, as suggested earlier in this report, is perhaps to be regarded as a blend of school policy, parental interest and child's attitude.
105. Two other variables appear in the 'top ten' in two of the analyses only. 61 Grammar school preference is important in the brightness and the score analyses, but much less so for backwardness. This is not an illogical result: for the average and above-average pupil this is a good measure of parental attitude, but is obviously less so for the backward child, when ambition is tempered with realism. Variable 50, Disrupted home, appears in the top half of the tables for backwardness and score, but it is less potent for brightness.
Differences
106. As a simple way of measuring differences, and to ensure that none was overlooked, the first factor loadings of all variables were ranked in order of numerical size for all three analyses. Rank differences were then found for each variable. Those with differences of 10 ranks or more* were then listed. These are given in Table XVI.
* (Out of 38 environmental variables: 37 Head teacher's rating of pupil, and 38 Result of 11+ selection tests were omitted - as they are in the table of loadings given previously - as belonging to the criterion category rather than the environmental.)
[page 381]
Table XVI
Variables with 10 or more ranks difference between analyses
| Variable | Rank placing |
| Bright | Score | Backward |
| 68 Husband's interest | 6 | 25 | 37 |
| 75 Changes of school | 9 | 29 | 36 |
| 63 Talks with head or class teacher | 16 | 27 | 34 |
| 61 Grammar school preference | 1 | 4 | 18 |
| 45 Material needs inadequate | 15 | 26 | 29 |
| 40 Discussed problem behaviour at school | 24 | 11 | 4 |
| 67 Child talks about school work | 29 | 30 | 13 |
| 66 Mother not too busy to help with school work | 30 | 31 | 15 |
| 50 Disrupted family | 18 | 10 | 8 |
| 55 Age parents completed education | 29 | 21 | 19 |
107. The top half of the table [68-45] shows those measures whose effect is stronger for brightness, the bottom half those which affect backwardness most. This brings out very clearly the difference already noted, that the factors affecting backwardness tend to be those denoting maternal attitude to the child, while for brightness the parents' attitude to education seems the more important. The backward child is a pupil beset with problems. Support, affection and understanding at home help him to surmount these. The potentially bright child, on the other hand, needs not so much help in overcoming difficulties as encouragement to take full advantage of the opportunities offered. The parents' view of schooling, the value they put on education, are the factors that are likely to affect the progress of the able child.
108. Nevertheless, there still remain some puzzles in Table XVI. Who would have hypothesised that 75 Changes of school would have the strongest effect on brightness, and the least on backwardness? It is true that the additional Factor 16 brings this in as a variable associated with backwardness at 7+, but even here its loading is low. This is a differential we find unable to understand. Similarly, the inadequacy of material needs, as a variable having a stronger association with brightness than with backwardness, is, at our present level of insight, inexplicable. Finally, 55 Age parents completed education adds a third element to our puzzlement. We have already commented on the pessimistic results for this particular variable, and it will be noted that its highest rank is 19th. But why should even this tenuous measure of association be confined to backwardness? A rank of 29 for brightness (corresponding to a loading of only .061) is, in our view, a wholly unexpected result.
SUMMARY
109. The schools analysis underlined the importance of the home background as a determinant of the educational progress and attainment of primary school children. This second phase of our inquiry, in which we look more closely at 186 individual pupils and their parents, begins to unravel some of the strands in this backcloth. It supports the schools analysis in finding that economic level and social class are much less important than aspects of parental atti-
[page 382]
tude, attitude to education, and attitude to books and reading. A high wage packet and a middle-class home does not guarantee a favourable background for educational progress, and literate homes with good parental attitude to school may be found in the slums as well as in the suburbs. Family literacy, as evinced by measures of reading and library membership, proves to be a highly significant measure in all three analyses of individual pupils. Parental attitude to education is an equally strong indicator of educational attainment. As a single measure of this, Preferred age of leaving is pre-eminent for the average and the backward child; Grammar school preference supersedes it for the bright child.
110. The factor of parental care which has manifested itself in all our school-based surveys begins to be more clearly delineated in the pupil analysis. Maternal attitude to the child and to his educational problems is shown as an important factor in the backwardness analysis. The problems associated with educational failure are likely to be eased with maternal support in a stable home, and so permit better school progress. On the other hand, the variable in this context which has most association with brightness is the father's interest in school work, which seems to act as a spur to (or a release of) ambition. A father's support and encouragement might well counteract the more adverse attitudinal forces of the neighbourhood and the peer group. The role of the mother defending and protecting the weak child and that of the father stimulating and encouraging the strong emerges surprisingly clearly from our analysis: but one suspects that the situation may not be quite so simple as it looks.
111. The pupil analysis is surprising in that it fails to support the emphasis given in the wider survey to factors of cleanliness and crime. The commanding position of these in the schools analysis is not paralleled in the analysis of individual pupils. This may be an accident of sampling - 186 pupils as against 2,000, and drawn from only 22 schools - or it may be that we need a more thorough investigation of the 'cleanliness' variable for individual homes. Only 23 out of 186 homes were rated by the Medical and Welfare departments as falling below an 'adequate' level: such a dichotomy is a very crude measure. Similarly only 17 of our families had any criminal record.
CONCLUSION
112. Our survey was necessarily a limited one, limited in time and in coverage. We have already commented on the narrowness of our criterion measures, and on the smallness of the sample of 44 schools drawn from only one, urban, region. Nevertheless, some significant results have emerged, as well as a score or more of questions which must lead on to further research. For our part, we regard two of our findings as being of the first importance: that environmental forces bear most heavily on the brightest of our children; and that factors in the home are overwhelmingly more powerful than those of the neighbourhood and the school - and of these, factors of parental attitude to education, to the school and to books are of far greater significance than social class and occupational level. There is strong reason to believe that adverse forces of this nature operate from the earliest ages, and we see the provision of nursery schools as an important way of attempting to counteract
[page 383]
them as early as possible. It seems patently obvious to us, too, that much more attention to environmental effects on education needs to be given in the training of our teachers, and we see the necessity to encourage, by every means, the institution of special courses within colleges of education. These should provide, for those students who so wish, a training in educational sociology and social work which will enable them to view these problems with a wider perspective, recognising that experiences outside the classroom are important not only for children but for teachers. In addition to such options in initial training courses, what is also needed are training courses for experienced teachers, so that they may be equipped to co-operate with the officers of the other social agencies within local authorities. Their task would be, not only to recognise cases of deprivation and to refer them to the appropriate experts, but also to bring home and school, parents and teachers, into closer relationship, to their mutual understanding and benefit. Such teachers are as necessary as remedial teachers, careers masters, or guidance counsellors, and would - like them - spend only part of their time within the classroom. The existence of a small corps of such teachers - social workers within an authority (and particularly the large urban authorities) would be of the greatest benefit in increasing our knowledge of the complex interactions between environment and educational attainment, and in developing new strategies in our efforts to provide the conditions for the full flowering of every child's potentiality.
[page 384]
ANNEX
I List of variables (school analysis)
II Varimax Factor Analysis (school analysis)
III List of variables (pupil analysis)
IV Loadings on significant factors (pupil analysis)
[Note Only Annexes I - III follow on pages 385 - 400: Annex IV does not appear in the printed edition.]
[page 385]
Annex I
LIST OF VARIABLES - SCHOOL ANALYSIS
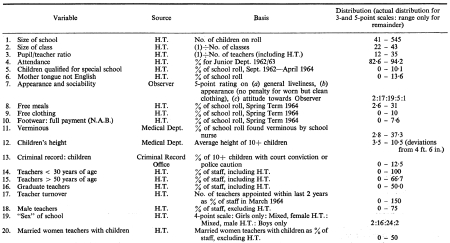 [click on the image for a larger version]
continued on next page
[page 386]
Annex I continued
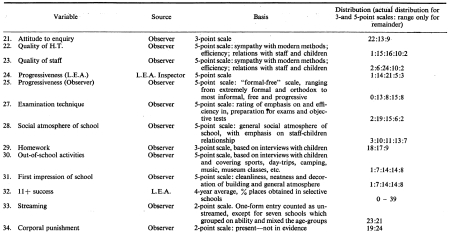 [click on the image for a larger version]
continued on next page
[page 387]
Annex I continued
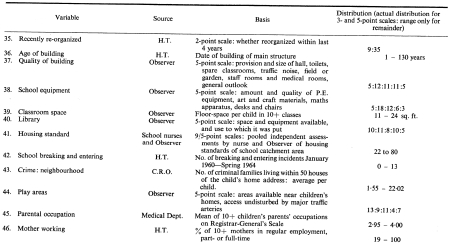 [click on the image for a larger version]
continued on next page
[page 388]
Annex I continued
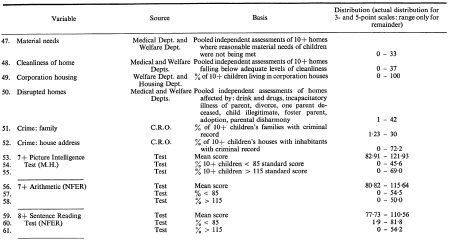 [click on the image for a larger version]
continued on next page
[page 389]
Annex I continued
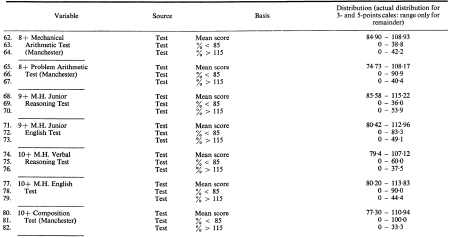 [click on the image for a larger version]
continued on next page
[page 390]
Annex I continued
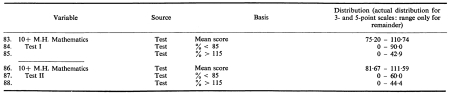 [click on the image for a larger version]
[page 391]
Annex II
VARIMAX ANALYSIS
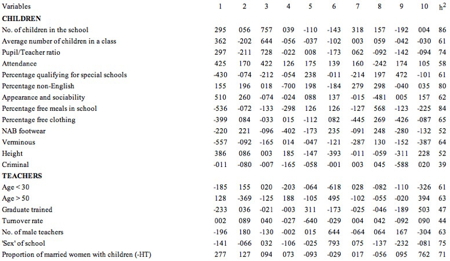 [click on the image for a larger version]
continued on next page
[page 392]
Annex II continued
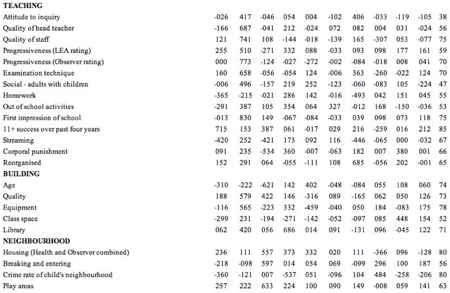 [click on the image for a larger version]
continued on next page
[page 393]
Annex II continued
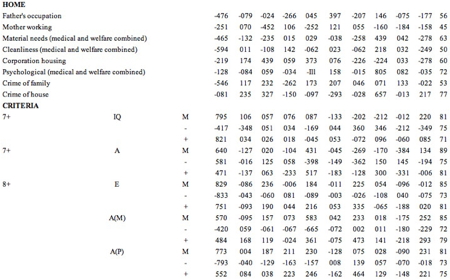 [click on the image for a larger version]
continued on next page
[page 394]
Annex II continued
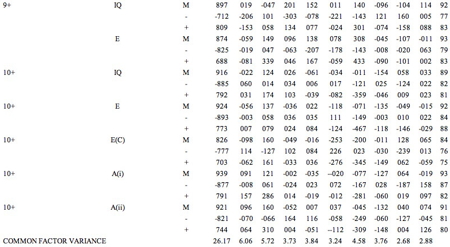 [click on the image for a larger version]
[page 395]
Annex III
LIST OF VARIABLES - PUPIL ANALYSIS
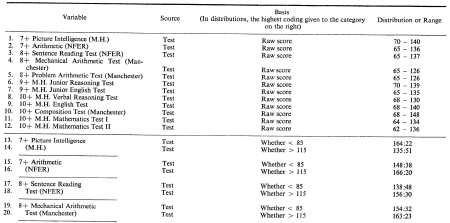 [click on the image for a larger version]
continued on next page
[page 396]
Annex III continued
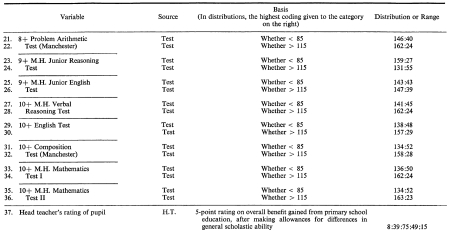 [click on the image for a larger version]
continued on next page
[page 397]
Annex III continued
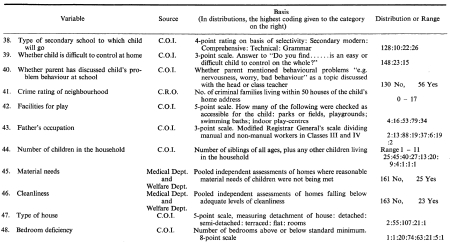 [click on the image for a larger version]
continued on next page
[page 398]
Annex III continued
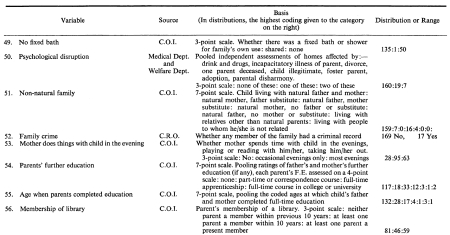 [click on the image for a larger version]
continued on next page
[page 399]
Annex III continued
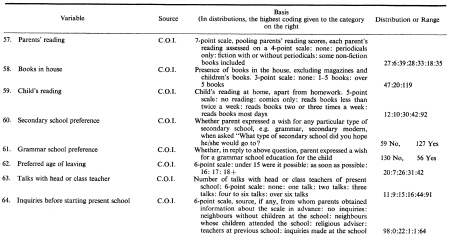 [click on the image for a larger version]
continued on next page
[page 400]
Annex III continued
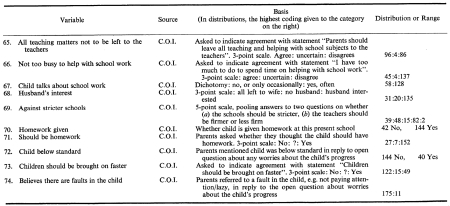 [click on the image for a larger version]
[page 401]
APPENDIX 10
FIRST REPORT OF THE NATIONAL CHILD DEVELOPMENT STUDY
(1958 COHORT)
1. In this Appendix we reproduce an abbreviated version of the First Report of the National Child Development Study (1958 Cohort). This multidisciplinary study of children born in 1958 has been financed, at the Council's suggestion, by the Department of Education and Science and other interested government departments in the belief that the data in the 1958 Perinatal Mortality Survey provided an opportunity for follow-up which should not be missed. It was hoped that a preliminary report would throw light on several of the major issues on which the Central Advisory Council were asked to report to the Secretary of State.
2. By any standards, the NCDS research team, directed by Dr M Kellmer Pringle and Professor Neville Butler, and led by Mr Ronald Davie, have succeeded well in providing us with an all-round picture of children at seven. Their success is all the more remarkable in view of the shortness of time in which they have produced their study. Unfortunately, there have been some disappointments - in the time available it was not possible, for example, to assess the effects of nursery education on children's subsequent performance at school. Other difficulties, particularly in the study of children settling in at school for the first time, have arisen from the fact that the study lay fallow for the seven years after the children were born - a reflection, perhaps, on the difficulty of getting funds for research. The risk of using data necessarily derived from parents' and teachers' recollection was bound to be present and was fully appreciated from the outset. This has been taken into account in interpreting the relevant results which, despite this inevitable shortcoming are, nevertheless, significant and valuable.
3. In the selection from the whole Report which is published here, two major excisions have been made. The full Report contains many tables of medical data. Some in the main text and most in the Appendix have been omitted for reasons of space. Secondly, the correlations between the data reported here and those in the 1958 Perinatal Mortality Survey had not been worked out at the time of publication and we are, therefore, unable to publish an interim report of them. We have also omitted the copies of the Questionnaires used by the Study. Our reasons for these omissions, apart from those of space, are that the whole of this First Report is to be published by Messrs. Longmans, Green & Company in January 1967, and those who wish to follow up medical data will find full details in that publication.
4. It will be clear to readers of this Appendix that the National Child Development Study promises to produce information of major importance to all who are interested in the educational, health and welfare services for children. We have already made use of their findings in our own Report. The NCDS research team will be the first to point out that these findings are preliminary, but they give a powerful indication at least of what more is to
[page 402]
follow. The sponsoring bodies, the University of London Institute of Child Health, the National Birthday Trust Fund, the National Bureau for Co-operation in Child Care, the National Foundation for Educational Research in England and Wales, are to be congratulated on encouraging the production of what promises to be a valuable contribution to our knowledge.
[page 403]
FIRST REPORT
of the
NATIONAL CHILD DEVELOPMENT STUDY
(1958 Cohort)
submitted to
THE CENTRAL ADVISORY COUNCIL FOR EDUCATION (ENGLAND)
APRIL, 1966
Sponsored by:
Institute of Child Health, University of London
National Birthday Trust Fund
National Bureau for Co-operation in Child Care
National Foundation for Educational Research in England and Wales
in collaboration with:
Association of Chief Education Officers (in England and Wales)
Society of Medical Officers of Health
Association of Directors of Education (in Scotland)
[page 404]
CONTENTS OF FULL REPORT (INCLUDING THOSE SECTIONS OMITTED IN THIS VERSION. REFERENCES TO SECTIONS AND TABLES FOLLOW THE FULL REPORT)
| Page |
| RESEARCH TEAM | 409 |
| STEERING COMMITTEE | - |
| CONSULTATIVE COMMITTEE | - |
| FOREWORD | 412 |
SECTION I: INTRODUCTION
| A. BACKGROUND TO THE STUDY | 413 |
| 1. The 1958 Perinatal Mortality Survey | 413 |
| 2. The National Child Development Study (1958 Cohort) | 413 |
| 3. The Structure of the Research | 414 |
| B. THE PRESENT REPORT | 415 |
SECTION II: DESCRIPTION OF THE SAMPLE
| A. THE POPULATION | 417 |
| B. THE PRESENT SAMPLE | 417 |
| C. INFERENCES MADE FROM THE SAMPLE | 419 |
| D. SOURCES OF BIAS IN THE PRESENT SAMPLE DUE TO NON-RESPONSE | 420 |
SECTION III: METHODOLOGY OF DATA COLLECTION
| A. DESIGN OF THE STRUCTURED QUESTIONNAIRES | 420 |
| B. THE EDUCATIONAL ASSESSMENT | 422 |
| 1. The 'Educational Assessment' booklet | 422 |
| 2. The Bristol Social-Adjustment Guide | 422 |
| 3. The Southgate Reading Test | 422 |
| 4. The 'Copying Designs' Test | 422 |
| 5. The 'Drawing a Man' Test | 423 |
| 6. The Problem Arithmetic Test | 423 |
| C. THE PARENTAL QUESTIONNAIRE | 423 |
| D. THE MEDICAL QUESTIONNAIRE | 424 |
| E. THE COMPLETION AND RETURN OF THE MATERIAL | 425 |
| F. DATA PROCESSING | 425 |
| SECTION IV: STATISTICAL ANALYSIS | 425 |
SECTION V: DESCRIPTIVE STATISTICS
| A. EDUCATIONAL FACTORS | 426 |
| 1. Introduction | 426 |
| 2. Reading ability | 428 |
| (a) Southgate Group Reading Test Results | 428 |
| (b) Stage Reached in Basic Reading Scheme | 429 |
| (i) Comparison between the sexes | 430 |
| (ii) The present findings | 431 |
| (iii) Comparison with Morris's results | 431 |
| (c) Teachers' Ratings of Reading Ability | 432 |
[page 405]
| 3. Ability in Number Work | 433 |
| (a) Problem Arithmetic Test Results | 433 |
| (b) Teachers' Ratings of Number Work | 434 |
| 4. Other Abilities | 436 |
| (a) Introduction | 436 |
| (b) Oral Ability | 436 |
| (c) Awareness of the World Around | 437 |
| (d) Creativity | 438 |
| 5. Backwardness and Difficulties in School | 439 |
| (a) Children Receiving Special Educational Help in Ordinary Schools | 439 |
| (b) Children in Need of Special Schooling | 441 |
| (c) Children Likely to Need Special Educational Treatment in Future | 441 |
| (d) Children Referred to Outside Agencies | 443 |
| 6. Summary | 444 |
| B. SCHOOL VARIABLES | 445 |
| 1. Introduction | 445 |
| 2. Contact Between Schools and Parents | 446 |
| 3. Introduction to School | 447 |
| 4. Allocation of Children to Classes | 447 |
| 5. Age of Starting Full-time Infant Schooling | 448 |
| 6. Age of Commencing Phonics in Reading | 450 |
| 7. Age of Commencing 'Formal' Written Arithmetic | 453 |
| 8. Summary | 455 |
| C. MEDICAL AND PHYSICAL FACTORS | 456 |
| 1. Introduction | 456 |
| (a) Medical History | 456 |
| (b) Medical Examination | 456 |
| 2. Speech | 457 |
| (a) Introduction | 457 |
| (b) History and Examination | 457 |
| (c) Speech Test | 458 |
| 3. Vision | 459 |
| (a) Introduction | 459 |
| (b) Visual Acuity | 459 |
| (c) Squint | 461 |
| (d) Visual Assessment | 462 |
| 4. Hearing | 463 |
| (a) Introduction | 463 |
| (b) Assessment of Hearing | 463 |
| (c) Hearing Test | 464 |
| (d) History of Hearing Difficulty and Clinic Attendance | 465 |
| 5. Laterality | 465 |
| (a) Introduction | 465 |
| (b) Handedness - Mothers' Information | 466 |
| (c) Tests of Laterality | 466 |
[page 406]
| 6. Dental Examination | 467 |
| (a) Introduction | 467 |
| (b) Dental Decay | 468 |
| 7. Micturition and Bowel Control | 469 |
| (a) Introduction | 469 |
| (b) Micturition and Bowel Control by Day | 470 |
| (c) Bedwetting | 470 |
| D. MEDICAL AND DEVELOPMENTAL SEX COMPARISONS | 471 |
| 1. Introduction | 471 |
| 2. Accidents | 472 |
| 3. Upper Respiratory Infections | 472 |
| 4. Psychosomatic and Behaviour Problems | 472 |
| 5. Convulsions | 473 |
| 6. 'Allergic' States | 473 |
| 7. Speech | 473 |
| 8. Ophthalmological Conditions | 473 |
| 9. Auditory Conditions | 473 |
| 10. Dental Status | 473 |
| 11. Congenital Malformations | 473 |
| 12. Hernia | 474 |
| E. ENVIRONMENTAL FACTORS | 474 |
| 1. Introduction | 474 |
| 2. Socio-Economic Status | 475 |
| 3. Family Structure | 477 |
| (a) Parental Situation | 477 |
| (b) Number of Children in the Household | 478 |
| 4. Overcrowding | 479 |
| 5. Mobility | 480 |
| (a) Moving Home | 480 |
| (b) Changing School | 481 |
| 6. School Attendance | 481 |
| 7. Parental Interest | 482 |
| 8. Parental Aspiration | 485 |
| 9. Summary | 486 |
| F. BEHAVIOUR AND ADJUSTMENT | 487 |
| 1. Introduction | 487 |
| 2. Behaviour and Adjustment - Teachers' Assessments | 489 |
| (a) Settling Down Period on Starting School | 489 |
| (b) Bristol Social-Adjustment Guide Scores | 490 |
| 3. Behaviour and Adjustment - Mothers' Reports | 492 |
| (a) Happiness at School | 492 |
| (b) Settling Down Period on First Starting School | 493 |
| (c) Developmental Difficulties | 495 |
| (d) Other Aspects of Children's Behaviour | 497 |
| 4. Summary | 499 |
[page 407]
SECTION VI: INTERRELATIONSHIP OF THE VARIABLES
| A. EDUCATIONAL FACTORS | 500 |
| 1. Reading and Arithmetic in Relation to Occupational Group | 500 |
| (a) Introduction | 500 |
| (b) Occupational Group and Attainment in Reading | 500 |
| (c) Occupational Group and Attainment in Arithmetic | 504 |
| (d) Summary | 505 |
| B. SCHOOL VARIABLES | 505 |
| 1. Length of Schooling, Educational Attainment and Adjustment in School | 505 |
| (a) Introduction | 505 |
| (b) Length of Schooling and Reading Attainment | 507 |
| (i) Analysis ignoring socio-economic factors | 507 |
| (ii) Analysis allowing for socio-economic factors | 507 |
| (c) Length of Schooling and Arithmetic Attainment | 509 |
| (i) Analysis ignoring socio-economic factors | 509 |
| (ii) Analysis allowing for socio-economic factors | 510 |
| (d) Length of Schooling and Adjustment in School | 511 |
| (i) Analysis ignoring socio-economic factors | 511 |
| (ii) Analysis allowing for socio-economic factors | 511 |
| (e) Summary | 514 |
| C. ENVIRONMENTAL FACTORS | 515 |
| 1. Parental Situation | 515 |
| (a) Introduction | 515 |
| (b) Occupational Groups | 516 |
| (c) Parental Situation and Southgate Reading Test Score | 516 |
| (d) Parental Situation, Occupational Group and Southgate Reading Test Score | 517 |
| (e) Summary | 518 |
| 2. Parental Approach | 519 |
| (a) Introduction | 519 |
| (b) Parental Approach and Occupational Group | 519 |
| (c) Parental Approach and Southgate Reading Test Score | 520 |
| (d) Parental Spproach and Southgate Reading Test Score within Occupational Groups | 522 |
| (e) Summary | 524 |
| D. BEHAVIOUR AND ADJUSTMENT | 525 |
| Adjustment in School in Relation to Occupational Groups | 525 |
SECTION VII: INTERIM FINDINGS - SUMMARY AND DISCUSSION OF MAIN FINDINGS
| A. EDUCATIONAL, BEHAVIOURAL AND SOCIAL ASPECTS | 528 |
| 1. Introduction | 528 |
| 2. Overview | 530 |
| (a) Settling at School | 530 |
| (b) Parental Interest | 530 |
[page 408]
| (c) Educational Attainment | 531 |
| (d) Behaviour and Adjustment | 532 |
| (e) Need for Special Provision | 533 |
| 3. Some Pointers to Policy and Practice | 534 |
| B. PHYSICAL AND MEDICAL ASPECTS | 536 |
| 1. Scope and Value of the Medical History and Examination | 536 |
| 2. Descriptive Statistics | 537 |
APPENDIX 1
| LIST OF APPENDIX TABLES | 540 |
| APPENDIX TABLES | 541 |
APPENDIX 2
| THE QUESTIONNAIRES | - |
| The Educational Assessment Booklet | - |
| The Parental Questionnaire | - |
| The Medical Questionnaire | - |
[page 409]
RESEARCH TEAM
Co-Directors:
Professor NR Butler, MD, FRCP, DCH. (1)
Mrs ML Kellmer Pringle, BA, PhD, Dip Ed Psych. (2)
Principal Research Officer:
R. Davie, BA, Dip Ed Psych.
Senior Medical Research Officer:
MJ Ball, BSc, MB, BS, DPH.
Research Officers:
Miss MJA Moncrieff, MA (October 1964 to November 1965);
Miss M Levius, BA (from November 1965).
Statistician:
H Goldstein, BSc. (3)
Administrative Secretary:
Miss V Shenton.
(1) Professor of Child Health, University of Bristol.
(2) Director, National Bureau for Co-operation in Child Care.
(3) Lecturer in Statistics, Institute of Child Health, University of London.
[page 410]
ACKNOWLEDGEMENTS
A project, such as the National Child Development Study, would not be possible without the help and co-operation of a large number of individuals and organisations. The sponsoring bodies of the Study, the Co-Directors and the research team gratefully acknowledge and thank all those who have contributed to this enormous task.
The Study has been carried out with the collaboration of the Association of Chief Education Officers (in England and Wales), the Society of Medical Officers of Health and the Association of Directors of Education (in Scotland), who have throughout given their advice and support.
Acknowledgement and thanks are due to the Central Advisory Council for Education (England) and the then Welsh Department, Department of Education and Science, and to the Scottish Education Department, who wrote to all the Local Education Authorities; and to the Ministry of Health for circularising the Local NHS Executive Councils.
Assistance was kindly given by the Senior Administrative Medical Officers of the Regional Hospital Boards, the staff of the Local NHS Executive Councils and also by many Children's Officers.
The staffs of The Government Social Survey (Central Office of Information), the General Register Office and the MRC Medical Sociology Research Unit in Aberdeen have given valuable advice and assistance.
The generous co-operation of the Chief Education Officers, Principal School Medical Officers and their staffs who were concerned with the administration of the Study in each local authority is gratefully acknowledged. They are warmly thanked for all the time and attention they have given to ensure the success of the Study.
Special appreciation must also be expressed to the teachers, school medical officers and health visitors and school welfare officers in every part of England, Scotland and Wales, who undertook all the interviewing, testing and examining. Without their help, indeed, the Study could not have been carried out. The parents of the children are most warmly thanked for their co-operation and support. It is the second time that most of them have given valuable information about their children.
The sponsoring bodies, the Co-Directors and the research team are glad to be able to take this opportunity of thanking the members of the Steering Committee, both collectively and individually, for their invaluable and unfailing help and support; and to acknowledge and thank the organisations and their representatives on the Consultative Committee.
Acknowledgement and thanks for the interest and specialist help are due to many people, all of whom cannot be named, but among whom must be mentioned: Mr WB Barrett, Dr DE Cullington, Mrs J Davey, Dr JJB Dempster, Dr PA Gardiner, Professor M Healy, Professor R IIlsley, Miss HJ Lewin, Miss M Manning, Dr IC Monro, Dr J Morris, Dr RC Pearson, Mr TV Pretty, Mr AP Round, Professor M Quenouille, and Dr M Sheridan.
Mrs V Booth and Dr DH Stott generously waived royalties on their test material, and the latter also gave further help.
[page 411]
Special thanks are due to the staffs of the four sponsoring bodies for all they have contributed and for their patience and competence in the face of the frequent and very heavy demands made on them.
Mention must also be made of all those temporary staff who for varying times have so enthusiastically helped with the vast amount of clerical and administrative work involved.
The University of London Press kindly supplied the Bristol Social-Adjustment Guides and the Southgate Tests at cost; and the Ames Company gave Urine Test material for all the children concerned.
[page 412]
FOREWORD
This Report, prepared for the Central Advisory Council for Education (England), is inevitably very much of an interim nature.
The follow-through Study of the 1958 Cohort of children was not begun until October 1964, and the task of tracing the whereabouts of 17,000 children nearly seven years after their birth was itself immense and had to be completed substantially before the field work could begin in 1965. Not unexpectedly, the analysis of the data for this Report had to commence before information on all the children had come in. Hence, the work reported here bears upon only 11,000 of the children in England and consists of relatively straightforward analyses.
It does, however, represent a considerable feat. The reader will be surprised at the width and richness of this harvest of facts - many of them barely surmised before - which have been obtained, analysed and presented in a total period of 19 months. The deadline for this Report could not have been met in this way without the fullest and most rapid co-operation of the schools, the parents, the medical and social services, without the organising skill and drive of the Co-Directors and, above all, without the devotion and competence of the very small research and clerical staff assigned to the project. Particular mention should be made of the Principal Research Officer, Mr R Davie, and the Statistician, Mr H Goldstein.
The Steering Committee wishes to place on record its awareness of certain inevitable shortcomings - the absence of the more complex and powerful analyses, the fact that the references to previous literature have not all been followed up, and the marks of haste which will be apparent to the attentive reader. It also wishes to underline the achievement of the team in carrying through what to many of us experienced in these things would appear an impossible task in the time.
WD WALL,
Chairman of the Steering Committee.
[page 413]
I: INTRODUCTION
The group of seven year old children featured in this Report are part of a larger national cohort in England, Scotland and Wales. The children were the subjects of a survey at the time of their birth; and information has now been gathered on many aspects of their growth and development. It is hoped that this study of the children can be continued at intervals throughout their childhood and, perhaps, into adult life.
A. BACKGROUND TO THE STUDY
1. The 1958 Perinatal Mortality Survey
In 1958 information was gathered on some 17,000 babies born during the week 3rd to 9th March in England, Scotland and Wales. This Survey (Butler and Bonham, 1963), sponsored by the National Birthday Trust Fund, reviewed the administration of British maternity services and the causes of perinatal death (still births and deaths in the first week).
During the course of the investigation a vast amount of sociological and medical data were collected about the children and their families, including details of the parents' education and occupations; antenatal care; any obstetrical medical complications; the duration of the pregnancy; and the condition and weight of the babies at birth.
This cohort of children can be considered unique for a number of reasons: it was a truly national series, selected only by date of birth; the very high proportion of returns (an estimated 98 per cent of all babies born during the week in question) reduced the possibility of any bias; and the comprehensive nature of the perinatal data was unparalleled in the world for any national cohort.
2. The National Child Development Study (1958 Cohort)
In 1964 the opportunity arose to trace and study these children again, and the National Child Development Study (1958 Cohort) was set up for this purpose. The Study is financially supported by a grant from the Department of Education and Science, the Home Office and the Scottish Education Department, and is sponsored by the four bodies detailed at the beginning of this Report; one of these bodies, the National Bureau for Co-operation in Child Care, is responsible for its administration.
The investigation is at present a three year project, but it is hoped that it will constitute the second stage of a longitudinal study of the original 1958 cohort of children throughout their childhood and into adult life. Thus, the aims of the Study can be divided into: short-term goals relating to the present three year investigation; and long-term aims which depend upon continued follow-up of the children. The former may be summarised as follows:
(a) To study the educational, behavioural, emotional, social and physical development of a large and representative group of British children in order to gather normative data; to investigate the complex interrelationships between the many facets, both normal and deviant, of children's development; and to report the incidence of handicaps and the provision currently being made.
(b) To utilise the uniquely comprehensive perinatal data, already available, in an evaluation of the relationships between conditions during pregnancy
[page 414]
and at birth, both medical and social, and the development of children in all its aspects at the age of seven years. From this investigation it is hoped amongst other things to determine some of the factors at birth which place children 'at risk' of developing handicapping conditions. Such information should permit early identification of 'vulnerable' children so that earlier diagnosis and treatment, or provision, will be possible. The kinds of disability about which this sort of information is needed are not only the grosser forms, but also the more numerous 'minimal' handicaps which, if undetected, at best prevent children from realising their full potential and, at worst, cause grave psychological damage due to the covert nature of the difficulties.
The long-term aims of the Study are:
(a) To explore the constancy and change in the pattern of children's development, longitudinally, and to investigate the associated educational, environmental and physical factors.
(b) To follow the progress - over a longer period - of those children who at birth might be considered 'at risk' in order to evaluate possible latent effects; and also to examine any post-natal factors, environmental, educational or medical, which may minimise a handicap.
(c) To identify and follow the progress of children who at seven years of age are already handicapped or showing signs of difficulty; those who because of adverse social or other circumstances might be considered 'at risk' of becoming educationally backward or socially deviant; and those who display exceptional talent or aptitude.
(d) To evaluate the efficacy of medical and educational provision for handicapped, deviant and exceptional children.
(e) To identify groups of children of special interest, including many of those enumerated under (c) and (d) above, so that intensive studies may be mounted by expert teams. This would permit much more detailed and comprehensive investigations of the factors involved against a 'backcloth' of the necessarily cruder data gathered in the follow-up of the whole cohort.
These aims demand an inter-disciplinary research team and an integrated approach. The Co-Directors are an educational psychologist and a paediatrician: the former is also the Director of the National Bureau for Co-operation in Child Care, providing a direct link with the body responsible for the administration of the Study; and the latter, having directed the 1958 Perinatal Survey, establishes a link with the earlier work. An educational psychologist has overall charge of the research, and the staff further consists of a Senior Medical Research Officer - for a period of 18 months - a Sociological Research Officer and an Administrative Secretary. In addition, a statistician was seconded part-time to the Study and has been concerned with all aspects of the research.
3. The Structure of the Research
The research team for the present three year project started their work in October 1964, with the exception of the Senior Medical Research Officer, who commenced three months later.
The children in the cohort were at this time about 6½ years old and it was decided to complete as much of the field work as possible by the end of July
[page 415]
1965 for a number of reasons. First, the majority of the children would be leaving infant schools and classes at this date and it was obviously desirable, where a change of school was involved, to gather educational information from teachers who, in many cases, had had the opportunity of observing the children's development over a number of years. Secondly, a change of school would involve further administrative work in tracing new schools. Thirdly, the Study had undertaken to present an interim report to the Central Advisory Council by the spring of 1966, so that time was extremely short.
Tracing the children was the first major exercise, and it would not have been practicable without the generous assistance of every local educational authority in the country. In response to a request from the Central Advisory Council for Education (England) and the then Welsh Department, Department of Education and Science, and from the Scottish Education Department, the authorities circularised schools, scrutinised their records and returned details of every child known to them born in the 'Survey week'. However, a sizeable minority of children were still untraced and a great deal of time and effort has been spent in reducing the size of this residual group in order to obtain a maximum possible return.
Even more administrative work was involved in the task of identifying the perinatal records of the 15,300 children whose names were returned so that the data gathered in the Perinatal Survey could be 'linked' with current data. The invaluable help of the General Register Office must be acknowledged here.
The Study was mounted in collaboration with the Association of Chief Education Officers (in England and Wales), the Association of Directors of Education (in Scotland) and the Society of Medical Officers of Health. With their support and advice, active co-operation was obtained from every local authority in gathering data on the children. The Chief Education Officers and Principal School Medical Officers kindly undertook to arrange for the completion and return of the questionnaires and tests used; and for the prior distribution of letters to schools and parents.
The material consisted of an 'Educational Assessment' booklet and five tests (for schools); a 'Parental Questionnaire' to be completed usually by a health visitor, in an interview with the mother; and a 'Medical Questionnaire' for completion by a school medical officer on examination of the child. Further details about this material and the processing of the data is contained in Section Ill: 'Methodology of Data Collection'. Copies of the three questionnaires are in Appendix 2.
The educational material was distributed to local authorities in March 1965, shortly after the children's seventh birthday, and the Parental and Medical Questionnaires were sent in the following month.
B. THE PRESENT REPORT
This Report, then, is of an interim nature, being produced about half-way through the span of the three year project. Further, it had in general to be confined to a consideration of the results for children in England because of the terms of reference of the Central Advisory Council. The data for the Scottish and Welsh children will, of course, feature in subsequent analyses.
Most of the first 18 months was, of course, devoted to tracing the children and then identifying their perinatal records; deciding what kinds of information would be gathered and from whom; formulating hypotheses to be tested;
[page 416]
designing the various questionnaires and selecting the most appropriate tests to be used; distributing material to all the local authorities; checking it for accuracy and completeness as it was returned; and transferring the data on to punched cards and then on to magnetic tape for computer analysis. More detailed accounts of some of these aspects of the project are given elsewhere in this Report.
In order to produce a report for the Central Advisory Council to consider, it was necessary to impose a 'deadline' after which no material could be included for analysis. Thus, material received after the middle of August 1965 has not been utilised, but will subsequently be added to the earlier material which forms the basis of the present Report; all the data, including the information on children in Wales and Scotland, will then be analysed afresh for the final Report of the three-year project.
The present Report, therefore, is based upon a sub-sample of the cohort of children. There is evidence of some bias in this sample of 'early returns', and this is fully discussed in Section lIB: 'Description of the Sample'. However, such bias as there is has been taken into account, where appropriate, in any interpretations made or conclusions drawn.
The terms of reference of the Central Advisory Council and the great speed with which the present Report had to be prepared have both played their part in shaping it. In addition, tentative interpretations of the results have been made where more elaborate or more sensitive statistical treatment is indicated but has not yet been possible.
Information obtained from this Study falls broadly into two categories. First there is a 'descriptive' element. A large amount of data has been gathered on a national sample of seven year old children. This information is of considerable interest and value in itself, providing as it does a picture of many facets of the children's education, growth, behaviour, health and environment. The results are presented and discussed in Section V: 'Descriptive Statistics'. Strictly speaking, however, this section is not of a purely 'descriptive' nature since, where appropriate, comparisons are made between the results for boys and for girls, so that hypotheses are being tested about possible sex differences.
The second category of information is contained in Section VI: 'Interrelationship of the Variables', which deals with a few of the relationships between the many factors likely to affect children's development. Of course, the most interesting relationships are causal ones because these are most likely to have practical implications. If, for example, it can be shown that a particular circumstance, or combination of circumstances, is likely to lead to certain adverse effects, the way may be open for preventive measures. Even where prevention is impossible, a knowledge of causation may permit some amelioration of the effects.
However, to demonstrate an association between factors is not necessarily to show a cause-effect relationship. For example, it is known that there is a relationship between children's height and their measured intelligence. But this does not mean that on the whole taller children are more intelligent than shorter ones because of their height. It seems probable that both of these factors are linked to others which form part of a complex web of predisposing conditions favouring both physical growth (in terms of height) and mental growth (in terms of intelligence).
[page 417]
Great care must therefore be taken in interpreting demonstrable relationships. The factors involved are often complex and subtle, and it is extremely unlikely that simple answers will be found to those questions we most want answered.
The analyses carried out and discussed in this Report are, then, in the nature of first steps along a difficult but challenging path towards a greater understanding of children's growth and development. Some of the results presented confirm those obtained by other workers in this field; some produce interesting new evidence; some point the way to further investigation; and some results have not been presented at all at this stage because of the danger of oversimplification or because it was considered advisable to await a more comprehensive analysis of all the material. Finally, there are, of course, many aspects of the Study which have not yet been examined for lack of time.
References
BUTLER NR and BONHAM DG Perinatal Mortality (E & S Livingstone Ltd) (1963)
II: DESCRIPTION OF THE SAMPLE
A. THE POPULATION
The population selected for the present Report consists of all children who were singleton births, living in England at the time of the survey, who were born between 3 and 9 March 1958, inclusive. (See Section III for a description of data collection.)
This Study was designed so as to include the surviving children of the Perinatal Mortality Survey (Butler & Bonham, 1963) who were currently living in England. In addition, the population includes immigrants and some children who were born in Britain during 3 - 9 March but who were, for various reasons, not included in the Perinatal Survey.
Where the population of interest is different from the above (e.g. children in local authority schools only), this is indicated in the body of the text.
B. THE PRESENT SAMPLE
The children included in the present sample are those for whom information had been received by the middle of August 1965.
Since more 'Educational Assessment' booklets had been completed by this date, and since punched cards - containing most of this information - were available at an early stage, some of the analyses were completed using this data before all the information on each child was available for analysis. The total number of children for whom most of the educational data were available was 10,963; of these, 10,833 were known to be in maintained infant, junior with infants or all-age schools, or in independent schools catering wholly or mainly for children who are not handicapped; and this latter figure is the total involved in 'counter sorter' analyses using these cards. The number of completed Parental and Medical Questionnaires received by the middle of August was 7,985; in general, therefore, where tabulations were produced from these questionnaires using the counter sorter, this latter is the
[page 418]
total involved. Where computer analyses were done, the totals for tables will vary according to the number of cases where particular information was unanswered. (See Section IIIF for the details of the data processing.)
In addition to the above, 1,896 'late returns' had come in by the beginning of January 1966. Although it was not possible to include these 'late returns' in the main analyses, the Social Class distribution has been compared with that of the present sample. An overall test of significance indicates a difference in the distributions, although a test for trend of the proportions of 'late returns' in each Social Class category (Registrar General's classification) from Class I to Class V was not significant (see Table 1). Thus, although there does appear to be a difference between the two groups occurring in Social Classes II and V, there is no evidence that it involves a shift towards one end of the (nominal) scale.
In most analyses, however, comparisons have been made within occupational group classifications, thus allowing for any bias arising in this way.
The 1961 census figures on occupational classification are also presented in Table 1. It should be noted that the present survey is of seven year old children, whereas the census figures relate to a sample of households.
Table 1
Occupational Group Distributions
Registrar General (1960)
Social Class
Classification | Present sample | Late returns | 1961
Census |
| N | Per cent | N | Per cent | Per cent |
| 1 | 443 | 5.7 | 96 | 5.1 | 3.8 |
| 2 | 1,131 | 14.6 | 338 | 17.8 | 17.0 |
| 3 | 4,387 | 56.8 | 1,025 | 54.1 | 51.3 |
| 4 | 1,322 | 17.1 | 292 | 15.4 | 20.3 |
| 5 | 440 | 5.7 | 145 | 7.6 | 7.6 |
| TOTAL | 7,723 | 100* | 1,896 | 100* | 100* |
Test present sample against late returns
Chi-squared (Trend) = 0.02; not significant
Chi-squared (Departure from linear trend) = 25.5 (3 d.f.); p < 0.001
Total chi-squared = 25.5 (4 d.f.); p < 0.001
*Throughout the Report percentages in tables are quoted to one decimal place and the total percentage is always given as 100.
A further comparison has been made using sex, reading and adjustment scores, comparing the children for whom there are educational data but no parental and medical information with those for whom this latter information is also available. Significantly worse adjustment and reading scores were found
[page 419]
among those children with the missing parental and medical information, but no significant difference was found in the proportion of the two sexes (see Table 2).
Table 2
(a)
Southgate
Reading Test
Score | Without parental and medical information | With parental and medical information |
| N | Per cent | N | Per cent |
| 0-3 | 29 | 0.8 | 40 | 0.6 |
| 4-6 | 96 | 2.6 | 115 | 1.7 |
| 7- 9 | 193 | 5.3 | 269 | 4.0 |
| 10-12 | 219 | 6.0 | 227 | 3.4 |
| 13-15 | 235 | 6.4 | 389 | 5.9 |
| 16-18 | 253 | 6.9 | 437 | 6.6 |
| 19-21 | 304 | 8.3 | 570 | 8.6 |
| 22-24 | 363 | 9.9 | 755 | 11.4 |
| 25-27 | 614 | 16.8 | 1,047 | 15.8 |
| 28-30 | 1,348 | 36.9 | 2,785 | 42.0 |
| TOTAL | 3,654 | 100 | 6,634 | 100 |
Chi-squared (Trend) = 50.2; p < 0.001
(b)
Bristol Social-
Adjustment
Guide Total
Score | Without parental and medical information | With parental and medical information |
| N | Per cent | N | Per cent |
| 0-9 | 1,975 | 59.0 | 4,305 | 66.6 |
| 10-19 | 828 | 24.7 | 1,395 | 21.6 |
| 20-29 | 402 | 12.0 | 591 | 9.1 |
| 30-39 | 116 | 3.5 | 152 | 2.3 |
| 40-49 | 24 | 0.7 | 19 | 0.3 |
| 50+ | 5 | 0.1 | 5 | 0.1 |
| TOTAL | 3,350 | 100 | 6,467 | 100 |
Chi-squared (Trend) = 65.2; p < 0.001
C. INFERENCES MADE FROM THE SAMPLE
Inferences from the present sample are strictly applicable only to the (one week) population as defined above. However, it may reasonably be assumed that this population is a representative, although strictly speaking non-random, sample from a larger population consisting of children aged between 7 and 7½ years (the ages when the data were obtained) who were born during an (unspecified) period of time which includes 3 to 9 March, 1958. Thus, interest centres on inferences made about all children aged between 7 and 7½. Therefore, the assumptions have been made that secular trends have not taken place - or were negligible - during such a period and that the period is
[page 420]
long compared to the one week of the sample; and for the purpose of testing hypotheses the sample has been treated as if it were a random sample from a population which, for practical purposes, can be considered infinite. Where it is felt that these assumptions are inadmissible, especially with regard to estimation of population means, this is indicated in the main text.
It must also be emphasised that the basic sampling unit is the child. It is not possible, therefore, to use the data directly to estimate population parameters of distributions where the basic units are not individual children but, for example, households or schools. Thus, an estimate of the mean size of infant schools, calculated in the usual way from the sample, would yield an estimate too large since the larger schools contribute more children to the sample.
All estimates which are given are therefore applicable only to the population of school children.
D. SOURCES OF BIAS IN THE PRESENT SAMPLE DUE TO NON-RESPONSE
In the present sample this matter has been investigated quantitatively in the comparison of 'early' with 'late' returns for occupational group, Reading and Social-Adjustment. Some of the possible sources of bias might, with advantage, be outlined.
Four categories of children who will not be included can be distinguished. First, there were those whose parents decided not to participate. This category is small - a little more than one per cent at present. Secondly, there were the children whose home circumstances made it impossible for a parental interview or medical examination to be made; or whose parents simply failed to keep appointments. This group will contain a disproportionate number of children from large families, socially underprivileged homes; or parents who for any reason have little time to devote to their children. Thirdly, there were the children in the cohort who have not as yet been traced or, having been traced, moved to another area and have not yet been retraced. It is likely that in the majority of these cases incorrectly recorded dates of birth or other clerical error is responsible. However, this category will contain a disproportionate number of children whose families move home frequently. The fourth category includes children who have emigrated since the 1958 Perinatal Study. This will be relevant only to associations with retrospective data, including the perinatal material.
References
BUTLER NR and BONHAM DG Perinatal Mortality (E & S Livingstone Ltd) (1963)
III: METHODOLOGY OF DATA COLLECTION
A. DESIGN OF THE STRUCTURED QUESTIONNAIRES
It was decided to gather the information from three main sources: from schools, by means of a questionnaire (the 'Educational Assessment' booklet), specific tests and other assessments; from mothers, who would be interviewed by an officer of the local authority, usually a health visitor, using a structured questionnaire (the 'Parental Questionnaire'); and from School
[page 421]
Health Services, who would undertake a medical examination, some special tests and complete a questionnaire (the 'Medical Questionnaire').
In considering the data to be collected, the following factors were particularly important:
1. The relative priorities to be given to contemporary and to retrospective data, having in mind that no information was gathered on the children during a seven-year period.
2. The extent to which comparable information could be obtained from many different field workers; and also the difficulty of interpreting data of a subjective nature.
3. The need to limit the burden of work and time for local authorities, schools and parents.
4. The time available for reviewing what others had done in the field, for drafting and 'piloting' the questionnaires.
5. The amount of time which would be available later for processing and analysing the material.
It became apparent at an early stage that the material would have to be designed so that the data could be transferred to punched cards. Furthermore, it was decided to structure the questionnaires so that the answers were, wherever possible, in pre-coded form; i.e. the field workers in response to the questions were asked to ring a code rather than write in an answer. This reduced the need for coding the material when it was returned. Such a structure, of course, imposed limitations upon the kinds of questions that could be included and determined to some extent the way in which they were asked.
It was further decided that the questionnaires should require no transcription sheets, so that the data could be punched direct on to cards from the forms themselves. Before the general layout was finalised, advice was sought both from the printers and from the commercial bureau who were to do the card punching. Amongst other factors which had to be decided were the size of print and paper, the spacing of the questions and hence the overall size of the documents. Important considerations here were general 'readability' and attractiveness of layout and, not least, the cost involved in terms of the weight and quality of paper.
By and large, the individual experience, skills and qualifications of the members of the research team determined who did the actual drafting of particular items or questionnaires. However, since the approach throughout was inter-disciplinary, regular and detailed discussions on all the questionnaires took place, involving the Co-Directors and the whole research team. Advice and comment was sought from all members of the Steering Committee and some members of the Consultative Committee, as well as from countless other individuals - doctors, teachers, health visitors, school welfare officers, research workers - all experts or practitioners in their respective fields. It was possible to do some piloting on all the questionnaires, but pressure of time meant that we were unable to do as much of this as would have been desirable. For the most part the material took shape and was finalised as a result of exhaustive discussion and consultation.
It was thought essential to ensure that anyone who was to use the material should know something about the Study. Each of the questionnaires, there-
[page 422]
fore, contained a brief summary of the background to the Study and its present aims.
B. THE EDUCATIONAL ASSESSMENT
A questionnaire was needed which would establish certain basic facts about the children's school environment, such as the type and size of school and size of class. It was thought desirable, too, to obtain some information about less tangible aspects of the environment, such as the contact between the school and the home, the 'social class' of the parents whose children attended the school and the basis on which children were allocated to classes. Finally, a fairly comprehensive picture was needed of the individual child: his abilities, his adjustment and behaviour and the interest and support given by his parents.
Finally, six different forms of assessment were decided upon:
1. The 'Educational Assessment' booklet which established facts about the school and its organisation, the relationship between the school and parents, and which required assessments by the teacher of the child's ability and certain aspects of his behaviour.
2. The Bristol Social Adjustment Guide (Stott, 1963) to obtain a picture of the child's behaviour in the school setting. The Guide is a four-page booklet containing some 250 descriptions of behaviour. The teacher is asked to underline the descriptions which best fit the child. Items of behaviour which are, in varying degrees, deviant or which may be symptomatic of emotional disturbance or social maladjustment are later identified by means of a system of coding and transferred to a separate form. It is thus possible, by summing the number of coded items, to obtain a quantitative assessment of the child's adjustment in school: the higher the score, the more indications there are of deviant behaviour. In addition, it is possible, by summing groups of coded items, to obtain a quantitative indication of the way in which any maladjustment is manifesting itself. Stott has suggested that certain 'syndromes' of behaviour disturbance are meaningful, and separate scores can be obtained for each (e.g. unforthcomingness, withdrawal, anxiety for acceptance by adults, hostility towards adults, 'inconsequential' behaviour).
3. The Southgate Reading Test (Southgate, 1962) for an objective assessment of the child's reading ability. This is essentially a test of word recognition. The child is asked to select from a number of words the one which corresponds to a picture in the test booklet; in other items the teacher reads out a word and, again, the child is asked to identify the word from a number which he has before him. There are 30 items in all in this test. A graded word reading test was considered, but it was felt that the Southgate Test was less likely to be known or used already by teachers in infant schools; that it would save time where there was more than one child in a school; that it would, possibly, be less formal and therefore less stressful for seven year olds. While this test was unable to extend the above average reader at this age, it did differentiate very clearly the backward readers. For the aims of the Study, this advantage outweighed the disadvantage of a rather low 'ceiling'.
4. The 'Copying Designs' Test to obtain some assessment of the child's perceptuo-motor ability. Although this test has been scored, it has not been possible as yet to use it for any analyses.
[page 423]
5. The 'Drawing a Man' Test as an indication of the child's general mental and perceptual ability as well as other maturational aspects. Although there has not been time or money available at this stage to mark and process this test, it is very cheap as well as quick and easy for teachers to administer; moreover, it was felt that it would provide them with a useful 'sandwich' between the formal tests. It is hoped eventually to use a more sophisticated marking procedure than that suggested by Goodenough (1926). When analysis does become possible, it is intended to correlate the results with other factors.
6. The Problem Arithmetic Test (copy excluded from this version) to assess the child's ability in this field. The individual items were chosen in the main from a large number previously used by the National Foundation for Educational Research, so that information was available on their facility values and it was possible to select those items which on a seven year old population would produce a normal distribution of scores. We are indebted to the NFER for their help on this.
Piloting of the educational assessment indicated that completion for one child would take from one to one and a half hours. For more than one child an additional half to three quarters of an hour per child would be needed. However, most teachers would have only one child in their class who was taking part in the Study.
C. THE PARENTAL QUESTIONNAIRE
A questionnaire had to be designed which would be suitable for completion by an officer of the local authority, usually a health visitor, by means of an interview, where possible, with the child's mother or permanent mother substitute. Specially trained interviewers would obviously have been preferable, but this was too costly even to consider.
It was soon realised that the problem of achieving a satisfactory compromise in terms of items which would be included was going to be most acute in this particular document. The chief difficulty lay in reconciling the need to obtain information about the child's present environment and development with the desirability of obtaining retrospective data over a seven-year period without over-burdening the informant and interviewer in terms of the time needed to complete the questionnaire.
It thus became essential to establish some priorities in respect of items to be included. It was felt that basic contemporary data should have first priority since in general these would normally be more reliable (i.e. less subject to distortion or simple inadequacy of memory) than retrospective details. However, some kinds of contemporary data, such as the parents' religion, could equally well be ascertained in future studies of the children and was therefore given lower priority.
With regard to retrospective information, a balance had to be achieved between the assumed importance of particular aspects in relation to the child's development and the extent to which any reliability could be attached to the mother's present report. Information about developmental milestones or pre-school difficulties are good illustrations of this difficulty. On the one hand, it was felt that such information would be valuable whilst on the other hand it seemed likely that mothers' memory of these events might not only be faulty - particularly if she had a large family - but, more important, might actively be influenced or distorted by the child's subsequent development.
[page 424]
Information about the emotional and intellectual climate in the home, the parents' aspirations for the child and their general attitudes towards bringing up children would have been most valuable. Reluctantly, it was decided, however, either to omit or cover only sketchily these particular areas because of the limitations of time, the varying circumstances under which the interviews would take place and the varying experience of the interviewers.
The Parental Questionnaire was considered to be the most suitable means of obtaining a full medical history from the mother. Not only would this save the doctor's time during the medical examination, but in many cases the health visitor might be acquainted with the health of the child, both in its pre-school and school days. It was advised, and proved possible in the great majority of cases, that the completed Parental Questionnaire be made available to the doctor in time for his examination of the child. For those instances in which this was not possible, part of the medical history, the systemically classified section, was reproduced in the Medical Questionnaire for completion or amendment at the time of the examination if this was thought necessary. Piloting of the questionnaires indicated that they would take an hour to an hour and a quarter to complete for an 'average' child.
D. THE MEDICAL QUESTIONNAIRE
A comprehensive medical examination of each child was considered to be an essential part of the follow-up of this cohort. Since the examinations were to involve large numbers of full-time and part-time medical officers of the local authorities, it was important to ensure as far as possible a uniform pattern of examination, as well as a standardised method of recording the findings. To give full clinical freedom in taking the medical history or in conducting the examination would create an impossible task in the classification and analysis of the data; at the other extreme, over-simplification leads not only to loss of information but also to a sense of frustration in professional field workers whose skills are not fully utilised.
It is hoped that the method by which medical data were gathered for this Study avoided these two extremes by careful questionnaire design. The spectrum of information was wide, whilst individual bands within that spectrum were sharply defined.
The pre-coded form of question was adopted to this end, and a questionnaire designed with sections classified in such a way that they matched the corresponding sections of the medical history in the Parental Questionnaire. To overcome the limitations imposed by the form of question used, the opportunity for written amplification of each answer was provided with each question.
In the case of tests of function and the examination of the special senses, the conditions for the examination were set out in detail in order to ensure that the results would be as comparable as possible.
The questionnaire included measurements of height, weight and head circumference: tests and assessments of vision, speech and hearing, including an audiogram; a urine test; tests of motor co-ordination and laterality; as well as a full clinical examination. Piloting indicated that, with the help of a school nurse, the whole examination, without the audiogram, would take 30-45 minutes.
[page 425]
E. THE COMPLETION AND RETURN OF THE MATERIAL
The material was sent in bulk to each local authority, which then made arrangements for its distribution, completion and return. In most cases, too, the authorities were able to give further help by checking the material for completeness before returning it.
F. DATA PROCESSING
The returned questionnaires and test forms were double checked by hand for completeness, coding errors, certain logical inconsistencies and accuracy of scoring. Where errors had occurred it was sometimes possible to rectify them by reference to other parts of the questionnaires.
The data for each child were punched on to seven 80-column cards, the last of which also contained information from the 1958 Perinatal Mortality Survey for those children whose records had been linked. These latter data were reproduced from the 1958 Survey punched cards.
The punching and verifying of the cards was carried out by a commercial bureau because of the size of this operation.
The first card containing most of the educational data for each child was punched by the end of August 1965 and used for 'counter sorter' analysis. When all seven cards for each child were available in January 1966, they were loaded on to magnetic tapes using the IBM.1401 computer at Imperial College, London, and the data were edited on the IBM.7090 computer at Imperial College for incorrectly coded and mis-punched information.
The edited magnetic tapes were then used for computer analysis on the 7090. This work was carried out using an adaptation of a program lent to the Study by the Government Social Survey (Central Office of Information).
Due to technical difficulties which could not be resolved in the time available, data for some 300 children could not be loaded from the cards on to the magnetic tapes. Thus, where comparable analyses were carried out on the computer and also on the counter sorter, the totals differ somewhat.
For the latter analyses, the cards (1 to 7) were divided into seven separate packs and straight counts and two-way tabulations produced from each pack.
References
GOODENOUGH F Measurement of Intelligence by Drawings (World Book Co.) (1926)
SOUTHGATE V Southgate Group Reading Tests: Manual of Instructions (University of London Press Ltd) (1962)
STOTT DH The Social-Adjustment of Children: Manual to the Bristol Social-Adjustment Guides (University of London Press Ltd) (1963)
IV: STATISTICAL ANALYSIS
Due largely to the shortage of time, the statistical analysis has been restricted to providing estimates for means and testing hypotheses of a straightforward nature, using the methods of analysis detailed below.
Since most of the hypotheses were concerned with associations in contingency tables, the basic method of analysis has been to apply an overall test of association. Although in some cases more detailed hypotheses have been formulated, it has not always been possible to use a more powerful procedure than the overall chi-square test.
[page 426]
In other cases, however, particularly where sex differences are concerned and a natural ordering exists in the levels of the other classification, a test for a linear trend of the proportion in the resulting 2 x K table has been carried out, with integers I to K used as scores. This also furnishes a valid test of no difference between the mean scores of the two levels of the dichotomous classification (Armitage, 1955). This test is referred to as the Trend Test.
It is also possible to obtain a test for departure from a linear trend. If no such departure exists, it may be inferred that the trend persists throughout the whole table and that the mean proportions in any two levels of the K-Ievel classification are different.
In relation to sex differences, one may reasonably assume in most cases that the sexes are randomised over other factors and that any contrast between the sexes is orthogonal with respect to the other factors.
One limitation of the present analyses is the absence of powerful tests for partial association in multi-dimensional tables, except in the special case of a 2 x 2 x K table (Birch, 1964). where the hypothesis concerns the partial association of two factors at fixed levels of a further factor and where the assumption of no second order interaction has been made; that is to say, the degree of association is the same in each constituent 2 x 2 table. Tests for second order interaction have been made (Plackett, 1962), and in no case has a significant interaction been found.
In any set of analyses on one sample, the statistical tests of hypotheses will not generally be independent. This fact must be taken into account in the interpretation of any results.
Furthermore, in a large group of independent tests, some are to be expected to show significance at the nominal level, even if the null hypotheses are true - purely by chance - and this has led to regarding the one per cent level rather than the five per cent level as the more appropriate one at which to begin rejecting null hypotheses, although significance values are shown at the five per cent as well as the one per cent and 0.1 per cent levels. Thus, the tendency has been towards a conservative interpretation of the results, which is also desirable in an interim report of this nature.
The hypotheses to be tested had all been formulated in advance. This was done on the basis of past evidence with a view to confirming the results of previous research studies and experience and to answer certain basic but relatively straightforward questions.
References
ARMITAGE P 'Tests for linear trends in proportions and frequencies'. Biometrics II, pp. 375-386 (1955)
BIRCH MW 'The Detection of Partial Association, I: The 2 x 2 case'. Journal of the Royal Statistical Society, Series B 26, pp. 313-324 (1964).
PLACKETT 'A Note on Interactions in Contingency Tables'. Journal of the Royal Statistical Society, Series B 24, pp. 162-166 (1962).
V: DESCRIPTIVE STATISTICS
A. EDUCATIONAL FACTORS
1. Introduction
The data included and discussed in this section were gathered from schools. The topics dealt with centre on children's abilities and the question of backwardness and difficulties in school; the results for boys and girls are compared.
[page 427]
It will be seen that the total number of children for whom results are given differs in various sub-sections. The reasons for this are outlined in Section lIB: 'Description of the Sample'.
However, they might with advantage be restated in so far as they relate to the educational data presented here. Most of these data were recorded on one 80-column punched card. This card was available at an earlier date than the other six cards and it was therefore possible by sorting the cards (using a 'counter sorter') to obtain information and produce simple tables. The number of children in English schools for whom this card was available was 10,963.
A breakdown of this number by the type of school attended is given in Table 3. It will be seen that 10,833 of the children were known to be in 'ordinary' maintained and independent schools, i.e. infant, junior with infants, and all-age schools and independent schools catering wholly or mainly for children who are not handicapped; 48 children were in special schools for handicapped pupils; and there were 73 children in schools which apparently did not fall into any of the categories listed. At a later stage, a re-scrutiny of the individual Educational Assessment booklets may make it possible to classify these schools.
Table 3
Type of School Attended
| No. of
children |
| Maintained schools |
| Infant School | 5,981 |
| Junior with Infants School (or Primary with Infants) | 4,529 |
| All-age | 34 |
| Day Special School | 32 |
| Residential Special School | 6 |
| Other | 40 |
| No data | 9 |
| Independent schools |
| Independent School (to include grant-aided schools) catering wholly or mainly for children who are not handicapped | 289 |
| Special School for handicapped children | 10 |
| Other | 33 |
| TOTAL | 10,963 |
In this sub-section, results are presented largely for children in 'ordinary' schools; thus, if the results were obtained by means of sorting punched cards, the total number of children involved is 10,833.
At a later stage in the data processing, the information was transferred to magnetic tape for computer analysis. There were one or two minor difficulties at that stage which could not be resolved in the time available, so the data for some 300 children had to be excluded. Where the results are presented from computer analysis, therefore, the total number of children involved in 'ordinary' schools is 10,596.
There is one further total which appears frequently in tables in this section where there is a comparison between the sexes. When the comparisons are one facet of more detailed computer analyses involving the occupational groups of the fathers, the figures for boys and for girls have been abstracted
[page 428]
from larger tables. Where the occupational group of the father was not known at the time, it was not possible to separate the boys from the girls in these larger tables (not presented in this Report). Thus, it has only been possible to compare the sexes, if the figures were abstracted from larger tables, when the occupational group was known. For these tables, then, the results are presented for a sub-sample of 6,878 children in 'ordinary' schools. There is evidence that this sub-sample is biased in certain respects: better reading ability; better social-adjustment in school. However, there is no reason to believe that this bias will affect the validity of the comparison between the boys and the girls in that group.
2. Reading Ability
(a) Southgate Group Reading Test Results
This test is one which is primarily an assessment of word recognition. The results have been abstracted from a more detailed table, not presented in this Report, and are for children in 'ordinary' maintained and independent schools. They are given in Table 4 and in graph form in Figure 1.
The superiority of the girls when compared with the boys is very clear. The difference in the distribution of the scores between the sexes is highly significant statistically. It will be seen that of the boys tested in this sub-sample only 1,202 (35 per cent) achieved a score of 28 or more, whereas 1,583 (approximately 47 per cent) of the girls did so. Further, the results of the statistical analysis confirm what inspection of the table suggest, namely, that there is a difference between the sexes at every level of reading ability, as assessed by this test.
The overall superiority of the girls was not unexpected and confirmed the hypothesis which was postulated in advance.
Table 4
Southgate Reading Test ScoreN = 6,878
Reading
Scores | Boys | Girls |
| N | Per cent | N | Per cent |
| 0-3 | 26 | 0.8 | 14 | 0.4 |
| 4-6 | 68 | 2.0 | 47 | 1.4 |
| 7-9 | 170 | 4.9 | 99 | 2.9 |
| 10-12 | 205 | 6.0 | 122 | 3.6 |
| 13-15 | 250 | 7.3 | 139 | 4.1 |
| 16-18 | 256 | 7.4 | 181 | 5.3 |
| 19-21 | 317 | 9.2 | 253 | 7.4 |
| 22-24 | 380 | 11.1 | 375 | 11.0 |
| 25-27 | 564 | 16.4 | 583 | 17.2 |
| 28-30 | 1,202 | 35.0 | 1,583 | 46.6 |
| Total tested | 3,438 | 100 | 3,396 | 100 |
| No data | 24 | | 20 | |
| GRAND TOTAL | 3,462 | | 3,416 | |
Chi-squared (Trend) = 137.4; p < 0.001
Chi-squared (Departure) = 13.8 (8 d.f.); p > 0.05 not significant
[page 429]
Table A1 of Appendix I gives a more representative picture when the results for boys and girls are combined and is based upon a larger sample of 10,596 children. One point is worthy of note in relation to the distribution of scores. The test clearly did not contain sufficient difficult items to 'extend' the more able readers. Thus, 47 per cent of the girls and about 35 per cent of the boys achieved a score of 28 or more out of a possible 30. This was expected and, as is explained elsewhere, this test was chosen partly because it was known that it would give good discrimination among the poorer readers.
Figure 1
Southgate Group Reading Test scores by sex
Children in Ordinary Maintained and Independent Schools
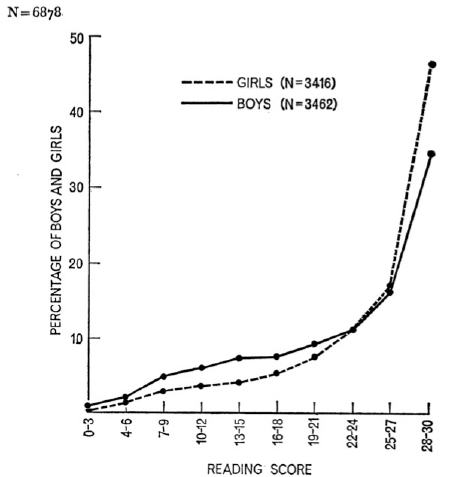
(b) Stage Reached in Basic Reading Scheme
In addition to the Southgate Test, information was obtained about the 'primer' or reading book in the basic reading scheme which the children were currently using.
This item of information was gathered to supplement the results of the reading test and a rating of the children's reading ability by their teachers. Secondly, it was considered that the results obtained would be of particular interest to teachers, since the assessment of a child's reading ability in terms of the primer he is reading is a familiar frame of reference. Thirdly, the results
[page 430]
would have possible implications for reading provision not only in infant but also in junior classes. Fourthly, it was felt that a comparison of the present findings with those of Morris (1959) in Kent schools would be valuable.
It is recognised that there will be some variability in the level of difficulty of books in the most widely used reading schemes. Nevertheless, Morris found - on questioning experienced teachers - that, despite the variability, meaningful distinctions could be made between children who had reached different stages. Thus, 'it was customary for infant teachers to consider a first primer as dividing the poor and non-readers from the rest at the age of seven'. Children who by this age were reading Book 2 or Book 3 were at this stage where their reading was mainly mechanical; such children still needed a great deal of skilled help and encouragement for optimal progress. Pupils who had reached Book 4 or beyond were considered to have true reading ability; given continued encouragement and appropriate reading material they were, on the whole, capable of sustaining progress without the need for specific help from the teacher.
(i) Comparison between the sexes
The results obtained for children in 'ordinary' maintained and independent schools are given in Tables 5 and 6. The figures in the first of these two tables were abstracted from a more detailed table, not presented in this Report, in order to compare the sexes.
Table 5
Stages Reached in Basic Reading SchemesN = 6,878
| Stage reached | Boys | Girls |
| N | Per cent | N | Per cent |
| Children on Book 4 or beyond | 1,604 | 46.8 | 2,126 | 63.0 |
| Children on Book 2 or 3 | 1,439 | 42.0 | 1,052 | 31.2 |
| Children on Book 1 or below | 382 | 11.2 | 198 | 5.9 |
| Total assessed | 3,425 | 100 | 3,376 | 100 |
| Don't know | 16 | | 19 | |
| No data | 21 | | 21 |
|
| GRAND TOTAL | 3,462 | | 3,416 | |
Chi-squared (Trend) = 186.3; p < 0.001
Chi-squared (Departure) = 4.95 (1 d.f.); 0.05 > p >0.01 not significant
The superior reading ability of the girls on this criterion is again very clear and highly significant statistically. This adds to the findings discussed in the previous sub-section in that the ability to read Book 4 or beyond will require not only word recognition but will, in the main, be accompanied by good comprehension of what is read.
The statistical evidence also indicates that there is no departure from this overall tendency. Thus, the difference between the sexes is consistent at all levels of reading ability, as assessed by this 'primer criterion'.
[page 431]
(ii) The present findings
The figures for the sexes are not totalled in Table 5 to give overall results because of possible bias. However, figures based on a larger sample of 10,596 children are given in Table 6 and there is no expectation of bias here. They are presented together with results achieved by Morris in her Kent sample.
Table 6
Stages Reached in Basic Reading SchemesN = 6,878
| Stage reached | Present sample | Kent sample
(Morris) |
| N | Per cent | N | Per cent |
| Children on Book 4 or beyond | 5,519 | 52.8 | 1,644 | 54.4 |
| Children on Book 2 or Book 3 | 3,899 | 37.3 | 797 | 26.4 |
| Children on Book 1 or below | 1,028 | 9.8 | 581 | 19.2 |
| Total assessed | 10,446 | 100 | 3,022 | 100 |
| Don't know | 55 | | | |
| No data | 95 | | | |
| GRAND TOTAL | 10,596 | | 3,022 | |
Chi-squared (Trend) = 29.8; p < 0.001
Chi-squared (Departure) = 224.7 (1 d.f.); p < 0.001
The present findings, in so far as they represent the national situation in 1965, indicate that some 10 per cent of seven year olds in the final term of their infant schooling had still barely made a start with reading. A further 37 per cent had progressed beyond this stage but continued to need specific help.
It has been acknowledged that this criterion of reading ability is relatively crude. Furthermore, the interim nature of the present report dictates a need for care in using precise figures. However, it is clear that a substantial proportion of children transferring to junior schools or classes has not reached a stage in reading where they can make optimal progress without continued teaching of the basic reading skills. Given the present age of transfer, it follows that teachers in charge of first-year junior classes should have a thorough knowledge of methods of teaching reading. Clearly this has practical implications for teacher training as well as for the staffing of junior schools and departments.
(iii) Comparison with Morris's results
It will be seen in Table 6 that there is virtually no difference in the proportion of children in the two samples who were on Book 4 or beyond. There may have been differences between the children of above average reading ability, but since this criterion gives no differentiation among this group, no conclusions can be drawn. The most striking difference between the samples is that whereas about 19 per cent of the Kent pupils had not progressed beyond a first primer, only 10 per cent of the children in the present sample were in this category.
[page 432]
Interpretation of the difference between the present 1965 findings and those of Morris, obtained in 1954, in terms of a national trend, is not straightforward, although the difference between the samples is, statistically, highly significant.
A number of factors must be considered. First, the average age of the Kent children when the assessment was made - at the beginning of their junior school course - would have been approximately 7½ years, slightly higher than that of the present sample. Secondly, it is very likely that the reading standard of these Kent children was above the national average, not only because of the generally higher socio-economic level in Kent, but also because Morris found on testing a sample of 10-11 year olds in that county 'that the reading attainment of Kent children at the end of their primary school course was above average for the country as a whole'.
Against this, the present sample included a proportion (less than three per cent) of children in independent schools whose reading standard as a group is likely to have been higher than for the rest of the sample, whereas the Kent pupils were all in maintained schools.
Thirdly, a small proportion of the present sample would no doubt have been using the 'initial teaching alphabet' (Downing, 1964) in learning to read, whilst none of Morris's sample would have done so. It is possible that this medium might alter the level of difficulty of primers and so change the nature of the criterion. Lastly, there were differences in the sampling technique used in the two studies.
These complicating factors impose a need for caution in interpretation. Further, if the difference between the two samples does reflect a national trend, it provides no evidence for an increase in the proportion of good readers. This is not to say that such a change has not taken place; unfortunately, this 'primer criterion' does not discriminate amongst the children of average reading ability and above, i.e. those who are reading Book 4 or beyond. Nevertheless, the difference between the proportion of children in the two samples who had not progressed beyond Book 1 is very marked. The tentative conclusion seems warranted that in the country as a whole the number of poor and non-readers transferring to junior schools and classes has dropped in the interval from 1954 to 1965.
(c) Teachers' Ratings of Reading Ability
A third assessment of the children's reading ability was obtained in the form of a rating by the teacher on a five-point scale.
In an attempt to increase the comparability of ratings made by several thousand different teachers, three steps were taken. A distribution of ratings was suggested which the teachers were told might be expected in a representative cross-section of children of this age; the teachers were asked to rate the child 'in relation to all children of his age (i.e. not just his present class or, even, school)'; verbal descriptions were given for each of the five possible ratings.
These verbal descriptions are detailed in Table 7, together with the results for boys and girls. Once again the figures are abstracted from a more detailed table, not presented in this Report, but the combined results for the sexes on a sample of 10,833 children in 'ordinary' maintained and independent schools are given in Appendix 1, Table A3.
[page 433]
Table 7
Teachers' Ratings of Reading AbilityN = 6,878
| Descriptions of ratings | Boys | Girls |
| N | Per cent | N | Per cent |
| Avid reader. Reads fluently and widely in relation to his age | 176 | 5.1 | 296 | 8.7 |
| Above average ability. Comprehends well what he reads | 716 | 20.8 | 1,016 | 29.8 |
| Average reader | 1,493 | 43.3 | 1,512 | 44.3 |
| Poor reader. Limited comprehension | 958 | 27.8 | 540 | 15.8 |
| Non-reader, or recognises very few words | 105 | 3.1 | 48 | 1.4 |
| Total tested | 3,448 | 100 | 3,412 | 100 |
| No data | 14 | | 4 | |
| GRAND TOTAL | 3,462 | | 3,416 | |
Chi-squared (Trend) = 206.3; p < 0.01
Chi-squared (Departure) = 14.0 (3 d.f.); 0.01 > p >0.001
Once again the superior reading ability of the girls in this sample can be clearly seen and is statistically highly significant. There were more girls (approximately 39 per cent) than boys (about 26 per cent) rated as of above average ability; also, there were fewer girls (approximately 17 per cent) than boys (approximately 31 per cent) below average.
The difference between the sexes is so marked, and confirmed by the results of the other two assessments of reading ability, that the firm conclusion is warranted that at this age girls are superior to boys in all aspects of reading ability.
3. Ability in Number Work
(a) Problem Arithmetic Test Results
There was some difficulty in deciding upon an appropriate objective assessment of the children's ability in number work. A test of mechanical arithmetic could have been devised or selected; but this, it was thought, would hardly do justice to the wider range of activities to be found in many infant classes. On the other hand, a test of mathematical concepts might have been time-consuming or difficult to administer. It was finally decided to devise a short test of problem arithmetic, thus avoiding some of the restrictions of purely mechanical calculation and assessing to some extent the ability to apply arithmetical knowledge to problems appropriate to this age group. The test was devised especially for use in this Study. There were ten problems in all and they were presented in the estimated order of difficulty. Six of the problems had been used before by the National Foundation for Educational Research on a large sample of seven year old children. Information was therefore available on the probable level of difficulty for these questions.
[page 434]
The original intention had been to make this an oral test to avoid penalising those children who could not read fluently. However, in doing this it was possible that some children would be put at a disadvantage because of difficulty in remembering questions accurately whilst calculating the answers. Thus, it was decided to present the problems in printed form but also to ask teachers to read the questions one at a time to the children (repeating where necessary) and allowing as much time as was needed for answering. If a child because of some disability was unable to write his answers, the teachers were asked to record them for him.
The results for a sub-sample of boys and girls in 'ordinary' schools are given in Table 8. They were abstracted from a larger table not presented in this Report. The combined results for the sexes taken from this same table on a sample of 10,596 children are given in Appendix I, Table A2.
Table 8
Problem Arithmetic ResultsN = 6,878
| Arithmetic scores | Boys | Girls |
| N | Per cent | N | Per cent |
| 0 | 76 | 2.2 | 68 | 2.0 |
| 1 | 145 | 4.2 | 147 | 4.3 |
| 2 | 290 | 8.4 | 325 | 9.6 |
| 3 | 384 | 11.2 | 478 | 14.1 |
| 4 | 479 | 14.0 | 493 | 14.5 |
| 5 | 502 | 14.6 | 476 | 14.0 |
| 6 | 470 | 13.7 | 443 | 13.1 |
| 7 | 374 | 10.9 | 399 | 11.8 |
| 8 | 332 | 9.7 | 268 | 7.9 |
| 9 | 237 | 6.9 | 181 | 5.3 |
| 10 | 143 | 4.2 | 114 | 3.4 |
| Total tested | 3,432 | 100 | 3,392 | 100 |
| No data | 30 | | 24 | |
| GRAND TOTAL | 3,462 | | 3,416 | |
Chi-squared (Trend) = 16.1; p < 0.001
Chi-squared (Departure) = 16.5 (9 d.f.); p >0.05 not significant
There was a highly significant difference between the distribution of scores for the sexes, strongly indicating that boys are superior to girls in the particular aspect of arithmetic ability assessed by this test. The statistical analysis provided no evidence of any departure from linear trend, indicating that this difference between the sexes persists over the whole range of test scores.
(b) Teachers' Ratings of Number Work
As with reading ability, a subjective rating was obtained from the teachers of the children's ability in number work. The introduction to all the ratings was the same and has been outlined in sub-section 2(c) of this section.
Once again, verbal descriptions were given for the five points on the rating
[page 435]
scale. It will be seen from these descriptions shown, together with the results in Table 8, that stress was laid upon an assessment of the children's insight and grasp of new processes rather than their ability to calculate accurately. These results were obtained from sorting the punched cards so that the total number of children involved is 10,833 (see Introduction to present section).
Table 9
Teachers' Ratings of Number Work
| Descriptions of ratings | Boys | Girls | Total |
| N | Per cent | N | Per cent | N | Per cent |
| Extremely good facility with number and/or other mathematical concepts. Grasps new processes very quickly. Shows insight and understanding | 205 | 3.7 | 120 | 2.3 | 325 | 3.0 |
| Understanding of number work well developed. Grasps new processes without difficulty | 1,008 | 18.2 | 856 | 16.2 | 1,864 | 17.2 |
| Average ability in this sphere | 2,332 | 42.1 | 2,385 | 45.1 | 4,717 | 43.6 |
| Rather slow to understand new processes. Rather poor facility with numbers, although able to do some things by rote | 1,780 | 32.2 | 1,757 | 33.2 | 3,537 | 32.7 |
| Little, if any, ability in this sphere. Shows virtually no understanding at all | 208 | 3.8 | 176 | 3.3 | 384 | 3.6 |
| Total rated | 5,533 | 100 | 5,294 | 100 | 10,827 | 100 |
| No data | 3 | | 3 | | 6 | |
| GRAND TOTAL | 5,536 | | 5,297 | | 10,833 | |
Chi-squared (Trend) = 9.5; 0.01 > p >0.001
Chi-squared (Departure) = 23.3 (3 d.f.); p < 0.001
The statistical test used rejects the hypothesis that there is no difference between boys and girls in their number ability as rated by their teachers. There was a significant overall tendency for the boys to receive higher ratings. However, the highly significant departure from linear trend shows that this tendency was not consistent at all levels of number ability.
Inspection of the table suggests that the reason for this departure from linear trend is that the proportion of boys and girls rated below average is virtually the same, approximately 36 per cent; on the other hand, about 22 per cent of the boys were rated above average, whilst only 18.5 per cent of the girls were placed in this category.
The conclusion seems warranted that within the framework of ratings which lay stress upon insight and understanding in number work, teachers feel that boys of this age show more evidence of above average ability, whereas there is little or no difference between the sexes in the proportions which are below average.
The difference between this finding and the analysis of the Problem Arithmetic testing, which produced no evidence of any differential results above
[page 436]
and below average for boys and girls, may be due to the different nature of the two assessments or to different aspects of number ability being assessed. Further research should throw more light on this matter.
However, the results of both assessments indicate that there are more boys than girls of above average arithmetic ability.
4. Other Abilities
(a) Introduction
In addition to assessments of number ability and reading, it was important to obtain a more complete and rounded picture of the children's abilities for a number of reasons. Thus, it is hoped at a later date to combine the assessments of other abilities in order to obtain a measure of the children's general level of intellectual functioning. Such a measure will make it possible, for example, to contrast those who are making slower progress in school than would be predicted from a knowledge of their general level of ability with those who are making better progress. Further, it will make possible analyses of the children's attainment when some allowance or correction has been made for those abilities less directly influenced by teaching in school.
An additional reason was that, although there is little published information about children's progress in reading and arithmetic in infant schools, there is even less available about other abilities.
It would have been possible, by adding an intelligence test to the range of objective tests included in the assessment of the children's development, to obtain a measure which might have fulfilled some of the functions outlined. However, intelligence tests which could readily have been administered by the teachers tend to have limited reliability at this age; further, it was felt that to add another test would have been an unreasonable imposition upon the teachers' time in the context of an educational assessment which was already to take more than an hour for an individual child.
It was decided, therefore, to obtain ratings by the teachers of each child's 'oral ability', 'awareness of the world around' and 'creativity'. These areas of functioning, it was felt, were very relevant to children's progress in school; they were aspects of development which schools would be attempting to foster; at the same time, they were likely to be influenced by factors outside the school to a greater extent than were reading or arithmetic.
The shortcomings of ratings were fully appreciated; and the attempts made to reduce subjectivity have been briefly outlined already (see sub-section 2(c) of the present section). Time has not yet permitted any 'pooling' of the ratings to obtain some more general measure; moreover, particular care will be needed in devising a system of weighting to take account of the different distributions of the three ratings.
In the following three sub-sections, the results for boys and girls are compared. The hypothesis tested in each case was that there would be no difference between the sexes.
(b) Oral Ability
The ability to express thought and meaning orally is of obvious relevance to educational progress. It cannot be equated with verbal ability, which embraces the capacity for understanding and dealing with verbal material of all kinds; nevertheless, these two abilities will be highly correlated. Since a rating
[page 437]
of verbal ability would be influenced to some extent by a child's performance in reading, it was decided to obtain an assessment of the children's oral ability, as it manifested itself in conversation and in the normal verbal inter-play of the classroom.
Table 10
Teachers' Ratings of Oral Ability
| Descriptions of ratings | Boys | Girls | Total |
| N | Per cent | N | Per cent | N | Per cent |
| In conversation, or oral lessons, has good vocabulary and variety of phrases in relation to his age | 749 | 13.5 | 805 | 15.2 | 1,554 | 14.4 |
| Average oral ability for his age | 2,810 | 50.8 | 2,910 | 54.9 | 5,720 | 52.8 |
| Below average oral ability, tends to use simple word groupings | 1,153 | 20.9 | 796 | 15.0 | 1,949 | 18.0 |
| Markedly poor oral ability | 247 | 4.5 | 120 | 2.3 | 367 | 3.4 |
| Total rated | 5,531 | 100 | 5,296 | 100 | 10,827 | 100 |
| No data | 5 | | 1 | | 6 | |
| GRAND TOTAL | 5,536 | | 5,297 | | 10,833 | |
Chi-squared (Trend) = 79.8; p < 0.001
Chi-squared (Departure) = 35.2 (3 d.f.); p < 0.001
There is a highly significant difference between the sexes, the girls receiving more favourable ratings than the boys. However, there was a highly significant departure from linear trend, indicating that the 'gap' between the sexes is not consistent at all levels of oral ability. The results suggest that there is a greater difference between the sexes below average than above. It will be seen that about 24 per cent of the boys were rated above average compared with 28 per cent of the girls; on the other hand, approximately 25 per cent of boys were rated below average, against 17 per cent of the girls.
It is likely that the superiority of the girls in this context is to some extent a reflection of their tendency to be more forthcoming, orally, at this age.
(c) Awareness of the World Around
Some may question the inclusion of this rating in a consideration of abilities on the grounds that what was being assessed was knowledge rather than ability. It could be argued that the acquisition of knowledge is dependent upon this knowledge being made available to a child and therefore it is not a 'true' ability. However, if 'awareness of the world around' is regarded as a child's ability to comprehend a complex world, the distinction is surely a fine one. It may be that this comprehension and the background of general knowledge which accompanies it is more dependent upon environmental factors than are many other facets of intellectual functioning; but this is a
[page 438]
matter of degree rather than kind. In any event, there can be little doubt about its relevance to and association with educational progress.
The results for children in 'ordinary' maintained and independent schools are given in Table 11.
Table 11
Awareness of the World Around
| Descriptions of ratings | Boys | Girls | Total |
| N | Per cent | N | Per cent | N | Per cent |
| Exceptionally well-informed for his age | 189 | 3.4 | 112 | 2.1 | 301 | 2.8 |
| Good background of general knowledge | 1,246 | 22.5 | 893 | 16.9 | 2,139 | 19.8 |
| Average in this respect | 2,471 | 44.7 | 2,818 | 53.3 | 5,289 | 48.9 |
| Rather limited knowledge | 1,374 | 24.8 | 1,275 | 24.1 | 2,649 | 24.5 |
| Largely ignorant of the world around him. Lack of general knowledge is a substantial handicap in school | 251 | 4.5 | 191 | 3.6 | 442 | 4.1 |
| Total rated | 5,531 | 100 | 5,289 | 100 | 10,820 | 100 |
| No data | 5 | | 8 | | 13 | |
| GRAND TOTAL | 5,536 | | 5,297 | | 10,833 | |
Chi-squared (Trend) = 12.1; p < 0.001
Chi-squared (Departure) = 95.1 (3 d.f.); p < 0.001
The statistical test for linear trend shows a highly significant tendency for boys to be given higher ratings for this factor. Again, however, there was a highly significant departure from the linear trend.
The results indicate that whereas a higher proportion of boys than girls are felt by their teachers to have above average 'awareness of the world around' - the proportions were about 26 per cent and 19 per cent respectively - there is little or no difference in the proportions below average. In fact, what small difference there was in this latter category in the present sample was in the girls' favour.
(d) Creativity
There has been increased interest in recent years in the assessment of creativity, particularly at the secondary school level. It has been claimed that it is possible to measure and distinguish creative thought processes from the kinds of ability assessed by conventional tests of intelligence. No attempt is made in the present Report to produce any fresh evidence on this topic; indeed, it is open to question whether such relatively crude measures as ratings could do so. Nevertheless, within the context of the assessments made, it was felt that such a rating might prove a useful and interesting addition.
One of the principal difficulties in assessing creativity is its multi-dimensional character, and it can operate in many different spheres. One can opt for a clearly defined area of creativity as, for example, in free written expression. However, to do so is to penalise those children with reading difficulties as well
[page 439]
as to exclude those whose creativity manifests itself in other activities. To ask for a more global assessment carries the risk of reduced reliability and validity, since the verbal descriptions of each point in the rating scale must be rather more general in nature. One way to escape from this dilemma is to ask for ratings of creativity in a number of well-defined fields. However, this would have been a further imposition upon the teachers' time, which was not felt to be justified.
It was finally decided to obtain a global assessment, but to stress the generality of the rating by giving examples of the activities in which it was anticipated that creativity would be shown. In the Educational Assessment booklet, therefore, the heading 'Creativity' was followed by: '(e.g. in free writing, telling a story, handwork, painting, drawing, dramatic work)'.
The results are shown in Table 12.
The difference between the distribution of rating was statistically highly significant. The result indicates that, as assessed by this rating scale, girls of this age are felt by their teachers to show more evidence of creativity in school. It will be noted that there was no statistically significant departure from this tendency, suggesting that the difference between the sexes is consistent at all levels of 'creative' ability.
Table 12
Teachers' Ratings of Creativity
| Descriptions of ratings | Boys | Girls | Total |
| N | Per cent | N | Per cent | N | Per cent |
| Shows marked originality or creativity in most areas | 154 | 2.8 | 152 | 2.9 | 306 | 2.8 |
| Usually produces good, original work | 806 | 14.6 | 983 | 18.6 | 1,789 | 16.5 |
| Shows some imagination or originality in most areas | 2,608 | 47.2 | 2,565 | 48.5 | 5,173 | 47.8 |
| Little originality or creativity in all areas | 1,765 | 32.0 | 1,456 | 27.5 | 3,221 | 29.8 |
| Never shows a trace of originality or creativity in any of his work | 190 | 3.4 | 136 | 2.6 | 326 | 3.0 |
| Total rated | 5,523 | 100 | 5,292 | 100 | 10,815 | 100 |
| No data | 13 | | 5 | | 18 | |
| GRAND TOTAL | 5,536 | | 5,297 | | 10,833 | |
Chi-squared (Trend) = 42.5; p < 0.001
Chi-squared (Departure) = 9.0 (3 d.f.); p > 0.05 not significant
5. Backwardness and Difficulties in School
(a) Children Receiving Special Educational Help in Ordinary Schools
Within the framework of the 'ordinary' school, the term 'special educational help' is here preferred to the more widely used 'special educational treatment' .
Children needing such help come within the broad definition of handicapped pupils categorised as 'educationally subnormal' (HMSO, 1953), namely:
[page 440]
'pupils who, by reason of limited ability or other conditions resulting in educational retardation, require some specialised form of education, wholly or partly in substitution for the education normally given in ordinary schools'.
This definition and its implications were further elaborated in 'Special Educational Treatment' and in 'Slow Learners at School' (HMSO, 1946 and 1964). It was made clear that the definition is interpreted broadly and covers every kind of educational provision for children who 'need special help', even if this is only 'in certain parts of their work'. It was estimated in the former publication that about 10 per cent of the school population would fall into this category; of these, some eight or nine per cent would be catered for in ordinary schools. These estimates related to 'registered pupils over the age of seven' but, in fact, excluded children of this age who were in infant classes; indeed, in a footnote it was indicated 'that special educational treatment is not normally required for infants unless they are so seriously retarded that they should attend a special school'. The statement is not in line with some more recent thought on this question; thus, 'a crucial time for getting to grips with backwardness is the last year of the infant school and the beginning of the junior school' (Tansley and Gulliford, 1960).
In order to identify children with learning difficulties and to throw some light on the current situation in infant classes, it was decided to ask the head teachers of the children in the present cohort whether the children were currently receiving any special educational help in school; and, if they were not receiving it, whether they would benefit from such help.
The first question was phrased: 'Apart from anything which the class teacher may be able to do in the normal way, is the child receiving any help within the school because of educational or mental backwardness?' Of the 10,833 children in ordinary schools for whom the information is available, approximately seven per cent of the boys (379) and four per cent of the girls (205) were receiving this help. The total proportion of children was thus over five per cent (584). The difference between the sexes in this respect was highly significant (p<.001).
Of those who were not receiving any help, the head teachers were asked if they considered that the children 'would benefit from such help within the school at the present time'. A further 879 children (eight per cent) the head teachers considered would benefit. Of these, 541 (10 per cent) were boys and 338 (six per cent) were girls. The difference between the sexes was again highly significant (p<.001).
It is particularly important that the figures relating to the second question be viewed in relation to its precise wording. The term 'would benefit' (i.e. from special help) was used; the corresponding term in the definition of educational subnormality, quoted above, was 'require'. The former term was considered to be more acceptable to head teachers in the context of the present study: it would minimise their natural reluctance to 'label' a child prematurely; and it would afford them greater freedom to express an opinion which had regard above all else for the needs of the individual child. Substitution of the term 'require' would, it is felt, have reduced the number of children thus classified by schools.
In summary, more than five per cent of the children were already receiving special educational help in infant classes and there was a further eight per
[page 441]
cent who, it was considered, would benefit from such help. The fact that more than 13 per cent of this sample could, with advantage, have been given such help stands in such marked contrast to the opinion expressed in the publication mentioned above (HMSO, 1946) that there is clearly an urgent need to re-examine this issue.
The question of provision at the junior stage is discussed in sub-section (c) of the present section.
(b) Children in Need of Special Schooling
The figures given at the beginning of this main section show that 48 (0.4 per cent) of the children were in special schools. It is likely that some of the 73 children in 'unclassified' schools were also receiving special schooling, but it is not possible to determine this at present since time does not permit individual re-scrutiny of the Educational Assessment booklets.
Of the children in ordinary schools, the head teachers were asked: 'Do you consider, irrespective of the facilities in your area, that the child would benefit now from attendance at a special school?' In their view, two per cent (219) of the children would have benefited; 2.6 per cent of the boys (144) and 1.4 per cent of the girls (75) were included in this category. The difference between the sexes was highly significant (p<.001).
In terms of the total number of children who might have benefited from special schooling at the infant stage, the above must be considered as minimum figures; for a further 190 children (1.8 per cent) the head teachers felt unable to give a definite answer. This latter group would obviously have contained a proportion of 'borderline' cases.
In interpreting the situation,. one must again weigh the effect of the term 'would benefit' used in this question. Nevertheless, it is felt that an affirmative answer about the need for transfer to a special school would not have been made by head teachers in respect of children still in infant classes without considerable forethought. The results would appear to reflect a need felt by the head teachers for earlier transfer to special schools than is currently the practice.
(c) Children Likely to Need Special Educational Treatment in Future
The term 'special educational treatment' is here used to denote special schooling as well as special educational help within an ordinary school.
As a separate question, the head teachers of all the children currently in ordinary schools were asked: 'Do you consider, irrespective of the facilities in your area, that the child is likely to need some form of special schooling or other special educational help within the next two years?' The number of children thus classified was 530 (approximately five per cent); 348 (6.3 per cent) of the boys were included in this total and 182 (3.4 per cent) of the girls. Once again, the difference between the sexes was highly significant (p<.001). There were a further 381 children (3.5 per cent) whose head teachers were not able to express a definite opinion as to their future needs. Again there were more boys than girls: 243 (4.4 per cent) and 138 (2.6 per cent) respectively. This difference, too, was highly significant (p<.001). It seems likely that the majority of these children would be 'borderline' cases.
The overall position is thus as follows:
(i) 48 children (0.4 per cent of the sample) were already in special schools.
[page 442]
(ii) 73 children (0.7 per cent) were in 'unclassified' schools, some of whom may have been ascertained as handicapped and have been receiving 'special educational treatment'. Inspection of documents at a later stage will enable this situation to be clarified.
(iii) 533 children (approximately five per cent) of the children in ordinary schools were said by their head teachers to be 'likely to need some form of special schooling or other special educational help within the next two years'. It must be made clear that this five per cent of children included the two per cent, mentioned in the previous sub-section, said to be currently in need of special schooling.
(iv) There were an additional 381 children (3.5 per cent) whose head teachers were not able to commit themselves on the question of future needs.
If one totals the proportions of children in items (i) and (iii), and makes the assumption that the majority of the children in item (iv) were 'borderline' cases and approximately half of them would in fact need help, then one would conclude that about seven per cent of the present sample were likely to need some form of 'special educational treatment' between the ages of seven and nine years. The assumption that the 3.5 per cent in item (iv) were 'borderline' cases is supported by the fact that three quarters of these children were rated as poor or non-readers by their teachers. A detailed scrutiny of the questionnaires at a later stage should enable a more precise estimate to be made.
However, at present there are three factors which prompt one to feel that the above estimate of seven per cent should be regarded as a minimum figure.
First, the fact that head teachers were asked in this question to predict the children's likely needs over a period of two years may have led to some reservations and a cautious approach which gave the child the benefit of any doubt.
Secondly, the possibility must be considered that the answers may have been influenced by the presentation of the question. The head teachers were asked: 'Do you consider, irrespective of the facilities in your area, that the child (a) would benefit now from attendance at a special school' (already discussed in sub-section (b)); and '(b) is likely to need some form of special schooling or other special educational help within the next two years?' It will be seen that the juxtaposition of the two questions, the order in which they were asked and the order of the two alternatives in the second question may have predisposed head teachers to have the possibility of special schooling uppermost in their minds. Further, the nature of the 'other special educational help' was not made explicit, which may have led some head teachers to have in mind a narrower concept of possible provision than is now embraced by the term 'special educational treatment'.
Thirdly, the evidence from the head teachers' replies to the question relating to the children's current educational needs - discussed in sub-section (a) - suggests that the above estimate of seven per cent should be seen as a minimum figure. It will be recalled that some 13 per cent of the children in the head teachers' opinions could, with advantage, have been given special educational help in ordinary schools. Although it is no doubt true that some of these children's need for help might have diminished or even disappeared by the time they transferred to junior classes, it is hardly credible that the proportion would have dropped so markedly - from 13 per cent to seven per
[page 443]
cent. One reason for this changed picture is likely to be the use of the term 'benefit from' (special help) in the earlier question and 'need' (special educational treatment) in the later one. It is arguable which of these terms best reflects the actual needs of children.
To summarise, then, it is estimated that at least seven per cent of the children in the present sample were likely to 'need' some form of special educational treatment whilst they were from seven to nine years old. It is difficult to compare this figure with the estimates of the incidence of children requiring 'special educational treatment', made by the Ministry of Education (HMSO, 1946), since these estimates give no indication of the incidence of multiple handicap. In particular, the definition of educationally subnormal pupils, quoted earlier, if strictly interpreted could include many of the children with other handicaps. In view of these complicating factors, all that can be said at the present stage is that our findings do not provide evidence on whether the figures given by the Ministry under- or over-estimate the position. There is strong evidence from the present Study to suggest that the phraseology used in defining children in need of special educational treatment is more crucial than may be realised.
(d) Children Referred to Outside Agencies
The original reasons for including a question about referral to outside agencies were fourfold: to discover which children had been referred so that a more detailed study of the causes of referral could be made; to study the extent to which various agencies had been used; to discover the overall proportion of children who had been referred; and to test the hypothesis that more boys than girls would have been referred.
Although identification of the children concerned is straightforward, a detailed study of the causes of referral and the use made of various agencies necessitates perusal and analysis of the individual 'Educational Assessment' booklets, and there has not yet been time for this. However, results are presented on the second two points.
The question was put to head teachers as follows:
'Has the child, because of difficulties which have affected his progress or behaviour in school, been referred to your knowledge to any agency? (e.g. School Health Service, Child Guidance Clinic, School Psychological Service, Education Welfare Service or School Attendance Officer, Children's Department, General Practitioner, Private Specialist.) (Include referrals made at a routine medical examination, and any made by another school or by the parents, if known.)'
Where the answer was 'Yes', the head teachers were asked to state the agency/agencies involved and, briefly, the reasons for referral.
The number of children in the sample reported to have been referred was 1,127 (9.5 per cent). It will be evident that this should be seen as a minimum figure since there would have been a number of children falling into this category where the information was not available to the head teachers for various reasons.
Approximately 11 per cent of the boys (604) and eight per cent of the girls (423) had been referred. The difference between the sexes in this respect was highly significant (p<.001). This result, then, confirmed the hypothesis previously postulated.
[page 444]
6. Summary
(a) Three criteria were used in assessing the children's reading ability: performance on a standardised test of word recognition (the Southgate Group Reading Test); the stage reached in the reading scheme used by the school; and the teacher's rating of reading ability on a five point scale.
Judged by all three criteria, the girls were better readers than the boys. The differences were so marked and consistent that the generalisation is warranted that at this stage in their schooling, shortly before transferring to junior schools and departments, girls are superior to boys in all respects of reading ability.
A comparison was made between the results of the present Study and a study conducted in 1954 (Morris, 1959). The tentative conclusion was reached that in the country as a whole, the number of poor and non-readers transferring to junior classes has dropped in the interval from 1954 to 1965. Approximately 47 per cent of the present sample had in the final stage of infant schooling not reached a stage where they could make optimal progress without further specific help in the acquisition of basic reading skills. About a fifth of these children (10 per cent of the present sample) had barely made a start with reading. It was clear that given the present age of transfer, junior schools and departments have to be prepared and equipped to continue the specific teaching of reading skills to a substantial proportion of their first year children.
(b) Two assessments were made of ability in number work: performance in a Problem Arithmetic Test designed for the present Study; and a teacher's rating of number work on a five-point scale which stressed insight and understanding rather than mechanical or rote ability.
There was evidence that in problem arithmetic ability, as assessed by this test, boys of this age are superior to girls. There was evidence from the analysis of the teachers' ratings, too, of superior ability amongst boys; but here the indications were that there are more boys of above average ability and no difference between the sexes in the proportions below average.
This variation in the results obtained may have been due to the nature of the two assessments or to the different aspects of arithmetical ability assessed.
(c) Ratings were also obtained from the teachers of the children's 'oral ability', 'awareness of the world around' and 'creativity'.
As rated by teachers, girls manifest better 'oral ability' than boys, and there were indications that this tendency is more marked in the children of below average 'oral ability' than those above average.
Boys are felt by their teachers to have more 'awareness of the world around' than girls, but this difference between the sexes appears to be confined to the children rated above average.
Compared with boys, girls show evidence at this age of superior 'creativity' as rated by their teachers.
(d) More than five per cent of the present sample in ordinary schools were receiving special educational help because of educational or mental backwardness. The head teachers considered that a further eight per cent would have benefited from such help.
[page 445]
In view of the statement (HMSO, 1946) that 'special educational treatment is not normally required for infants unless they are so seriously retarded that they should attend a special school', the present findings indicate a need to re-examine this matter.
(e) Approximately 0.4 per cent of the sample were known to be in special schools. Of the children in ordinary schools, head teachers considered that about two per cent would currently have benefited from special schooling. For a further 1.8 per cent the head teachers did not feel able to express a definite opinion. These results appeared to reflect a need felt by the head teachers for earlier transfer to special schools than is the practice at the present time.
(f) It was estimated on the basis of head teachers' opinions that at least seven per cent of the present sample were likely to need special educational treatment whilst they were between the ages of seven and nine years. However, there were a number of complicating factors and it was not possible to draw any conclusions about the accuracy of estimates previously made (HMSO, 1946).
There was evidence that when head teachers' opinions are sought on the question of special educational treatment, the precise terminology used is of more importance than may be realised. If it is asked whether children 'would benefit' from such provision, the proportion of children included is likely to be higher than if the term 'need' (and, probably, 'require') is used. It is arguable which of these terms is most appropriate.
References
DEPARTMENT OF EDUCATION AND SCIENCE Slow Learners at School Pamphlet No. 46 (HMSO) (1964).
MINISTRY OF EDUCATION School Health Service and Handicapped Pupils Regulations (HMSO) (1953).
MINISTRY OF EDUCATION Special Educational Treatment Pamphlet No. 5 (HMSO) (1946).
DOWNING J The i.t.a. Reading Experiment (Evans Bros.) (1964).
MORRIS JM Reading in the Primary School (National Foundation for Educational Research) (1959).
TANSLEY AE and GULLIFORD R The Education of Slow Learning Children (Routledge and Kegan Paul) (1960).
B. SCHOOL VARIABLES
1. Introduction
All the information gathered in this project was judged to have possible relevance to the development of individual children. Some of the data describes characteristics of the schools, and it is intended at a later stage to test certain hypotheses concerning associations between these characteristics and the development of the children.
In this section descriptive statistics are presented for those school variables upon which little or no information is available from other sources. It must be emphasised here that the Study is concerned essentially with a representative sample of children and not of schools. Thus, the data cannot be used
[page 446]
to answer this kind of question: 'What proportion of schools catering for seven year olds have parent/teacher associations?' However, the data can answer the question: 'What proportion of seven year olds are in schools which have a parent/teacher association?' There may, in fact, be little or no difference between the answers to the two kinds of question; but where the characteristic being considered is related to the size of the school there will be a difference, since larger schools contribute more children to the cohort than smaller ones.
The 10,833 children for whom information is given in this section were all in maintained infant, junior with infants or all-age schools, or in independent schools catering wholly or mainly for children who are not handicapped. The actual numbers in each type of school are detailed in the Introduction to Section VA: 'Educational Factors'. In one sub-section (5) the results for a smaller sample of children had to be used for reasons which are mentioned in this sub-section.
2. Contact Between Schools and Parents
Of course, the most important contacts made are those in which parents discuss their children with the teacher or head teacher. This topic is specifically dealt with in Section VF: 'Environmental Factors'.
In this sub-section the emphasis is upon organised and relatively more formal contacts between the school and the parents. Nevertheless, these also create opportunities for informal discussion. There is a wide range of school activities and occasions in which parents may participate. An attempt was made to seek information about those contacts which might best reflect the general tenor of the relationship between the school and the home; also those which at a later stage of analysis might afford some measure of discrimination between schools which chose - or were able - to foster actively the interest and involvement of the parents in the school's work. Even within this general area a rigorous selection of questions had to be made to achieve a reasonable balance between the various educational aspects to be studied.
Four questions were put to schools and the results are detailed in Table 13.
Table 13
Contact Between Schools and ParentsN = 10,833
| N | Per cent |
| The number of children at schools which had a parent/teacher association | 1,861 | 17.2 |
| The number of children at schools where meetings were arranged for parents, by school or association, on educational matters | 6,668 | 61.6 |
| The number of children at schools where any social functions were organised for parents | 5,628 | 52.0 |
| The number of children at schools where parents provided substantial help for the school in money, kind or labour | 5,788 | 53.4 |
[page 447]
Although these results are given in one table, it will be appreciated that the questions were not mutually exclusive. The numbers in each category are expressed as a percentage of 10,833.
It is clear that the majority of the schools in this sample preferred to establish contacts with parents without the more formal framework of a parent/teacher association.
3. Introduction to School
It is the practice of some head teachers to allow pre-school children to spend some time in the school before they actually start. Many people consider that this has much to commend it. It goes some way towards lessening any anxiety felt by children as they approach what is for them a new world. Whether the practice is adopted will depend upon a number of factors, amongst which the staff/pupil ratio is likely to be very important. In this sample, the schools of 3,443 children (approximately 32 per cent) were in fact, using some form of 'introductory attendance'.
4. Allocation of Children to Classes
The question of the allocation of children to classes is more complex than would at first appear. It might seem that children are either 'streamed' by ability - however this is assessed - or they are not. Instead, one is not faced with two possibilities but with a continuum. At one end of this continuum would lie those schools in which the head teacher feels that the best class grouping is one which achieves the greatest heterogeneity in terms of the children's ages and abilities. Infant school head teachers who adopt this approach place children from five to seven years old in the same class, deliberately setting out to achieve a wide ability and age range. Such a practice is sometimes referred to as 'family grouping'.
At the other end of the continuum are head teachers who feel that the more homogeneous the class, the better is the teacher able to meet the needs of the children. Such a head teacher would 'stream' by ability, where possible. In between these two positions are a large variety of situations: for example, all the infants may be in one class, so that a heterogeneous group is inevitable; or children may be allocated to classes by age, in which case a measure of homogeneity is sought. Even between classes formed in the same overt way there will be differences in approach on the part of the teachers which will reflect in some measure their attitudes - or those of the head teachers - towards this question.
Enough has been said to outline some of the difficulties in assessing what is basically an educational approach or an attitude. All that was possible in the present Study was to obtain relatively crude information on the method of allocation to classes. It was felt, nevertheless, that this data, despite their limitations, would be valuable since no other information appears to have been published in this country on pupils' allocation to classes at the infant stage.
[page 448]
Table 14
Formation of Class
| N | Per cent |
| One class only for all 'infants' | 531 | 4.9 |
| A deliberate cross-section by age and ability of more than one year group of children-sometimes called 'family grouping' | 576 | 5.3 |
| By age in year groups (e.g., one class per year, or parallel classes) | 4,122 | 38.1 |
| Selected by age within the year group (e.g. children born in the first half of the year in one class, and the remainder in another) | 3,738 | 34.6 |
| 'Streamed' by ability or attainment: |
| An upper ability (or attainment) class within the school | 402 | 3.7 |
| A middle ability (or attainment) class within the school (e.g. of three classes) | 171 | 1.6 |
| A lower ability (or attainment) class within the school | 220 | 2.0 |
| Other arrangements | 1,057 | 9.8 |
| Total answered | 10,817 | 100 |
| No data | 16 | |
| GRAND TOTAL | 10,833 | |
It will be seen that the majority of the children (about 73 per cent) were allocated to classes by age: in year groups, or selected by age within the year group. Approximately seven per cent were overtly 'streamed' by ability or attainment. However, there was a further 10 per cent of children in classes formed by 'other arrangements'. It seems likely that in the majority of these classes an attempt was being made to achieve some kind of homogeneous grouping; for example, by promoting brighter children to a higher class or holding back the less able.
The nature of these 'other arrangements' has been detailed by the schools, but at this stage time does not permit an analysis of the replies.
5. Age of Starting Full-time Infant Schooling
There has been increasing interest of late in the association between date of birth and educational performance. Younger children in any school year group appear to be at a disadvantage compared with the older ones (Pidgeon, 1965).
There is clearly more than one factor operating here, but an important one would seem to be the length of schooling obtained. The age at which children are admitted to infant schools in England varies between education authorities and also within authorities from year to year depending upon the provision available in relation to the numbers of children approaching the age of five. Two years is the minimum period normally spent in an infant school or department, but children are in some areas admitted at four years of age, provided that they will become five before the start of the next term, whilst in others an earlier start than this is possible. In some cases, therefore, a much longer period than two years is spent in school before transfer to a junior school or department.
[page 449]
Thus, although the children in the present sample are virtually all of the same age, it was known that there would be differences in the length of schooling received prior to the present educational assessment. In Section VIB the relationship between the age of starting full-time infant schooling, educational performance and social adjustment at seven years of age is examined.
Here, the numbers of children starting full-time infant schooling at different ages is presented. It will be noted that the total number of children (5,805) is much smaller than elsewhere in this section.
There are a number of reasons for this. First, it was only possible to include children for whom a Parental Questionnaire had been received when the data processing was commenced, because the information about the age of starting school was obtained from the mothers. Secondly, children are included only where it was known that they had not attended a nursery school or class, since it was felt that children who had had nursery schooling might as a group be atypical in this context; furthermore, it would in some cases be difficult to determine when nursery schooling ceased and infant schooling commenced. Another fact to be noted is that the figures detailed below are abstracted from a larger table, not included in this Report, which includes a breakdown of the figures in relation to the occupational group of the father. Thus, children for whom this information was not available, including those in families where there was no male head of the household, are grouped together with those who started school outside the limits of the three age groupings for which numbers are detailed.
Table 15
Age of Starting Full-time Infant Schooling
| N | Per cent |
| 4 years to 4 years 5 months | 75 | 1.3 |
| 4 years 6 months to 4 years 11 months | 2,772 | 47.8 |
| 5 years to 5 years 5 months | 2,505 | 43.2 |
| Started school outside these limits or Occupational Group of father not known | 448 | 7.7 |
| Total information | 5,800 | 100 |
| No data | 5 | |
| GRAND TOTAL | 5,805 | |
The results indicate that nearly half of this sub-sample started school when they were between 4 years 6 months to 4 years 11 months old. The great majority of these would have started school in January 1963, since they were five years old in March of that year. Over 43 per cent would have started school at the beginning of the following term.
In assessing the reliability of these figures and the extent to which they may be representative of the situation in the country as a whole, a number of factors should be borne in mind.
First, the fact that those children who could not be classified by the occupational group of their fathers are included with those who started school
[page 450]
outside the three specified age groupings will depress the percentage figures for these groupings. However, the effect of this has been checked; it is minimal and does not alter the overall position.
Secondly, the information was obtained from the mothers, and some may have had difficulty in recalling an event which occurred two years earlier in terms of the age categories detailed above. As against this, the question was put by health visitors - or another officer of the local authority - who would have helped mothers, where necessary, with this 'calculation'. Of course, health visitors are likely to be familiar with local practice.
Thirdly, the school year 1962-63 was a difficult one for schools and authorities because of the effect of increasing the training college courses for teachers from two to three years at this time. The consequent acute shortage of staff may have forced some schools to take children later than was their usual practice.
For these reasons, then, the figures should be viewed with some caution. However, despite these reservations, the suggestion by Pidgeon and Dodds (1961) that 'There is a general, but not universal, rule in this country that children start formal schooling at the beginning of the term in which they will become five years old' clearly needs re-examination in the light of our findings.
6. Age of Commencing Phonics in Reading
There is a wide variety of possible approaches to the introduction and subsequent teaching of reading. In this Study one particular aspect was selected for closer investigation; namely the stage at which a systematic attempt is made to introduce children to the sounds of individual letters or phonemes. The introduction of 'phonics' - as this is customarily termed - is made much earlier in the reading programme in some schools than in others. There has been - and still is - considerable debate amongst schools, and in educational circles generally, about the age at which phonics should be systematically taught. To say that the right time is when the individual child is 'ready' is to avoid the issue in the absence of any universally agreed or well validated criteria as to what constitutes readiness.
This Study cannot claim to throw any new light of an experimental nature upon this question. However, it can give information, hitherto not available, about the age at which this systematic introduction is in fact commenced in schools. Although this Report is concerned with children in England, it was felt that comparative figures for Wales and Scotland would be of interest in this particular context. The results are given in Table 16 and reproduced in graph form in Figure 2.
It will be seen that there are a substantial number of 'Don't knows' in this table. This was expected, since the data for most of the children were retrospective and staff changes, as well as changes of school by the children, will have meant that information on this question was sometimes unobtainable. However, there is no reason to believe that if the information for these children had been available it would have differed in overall pattern from that obtained for the rest of the children. Thus, it was felt appropriate to exclude 'Don't know' replies from the percentaging.
The differences between the three countries are marked and interesting. The English pupils were introduced to phonics at a later age: the peak age for its introduction in the English schools was from 5 years 6 months to 5 years 11
[page 451]
months, whilst in Wales and Scotland the corresponding age was from 5 years to 5 years 5 months. The differences in the distribution, both between England and Wales and between England and Scotland, are highly significant statistically. Phonics had been taught to about 54 per cent of the children for whom this information was available in Scottish schools before the age of 5½ and to 46 per cent of the children in Welsh schools; the corresponding percentage for the children in England was about 29 per cent.
Since no teacher would commence teaching phonics before she considered a child was ready for this step, it would appear that the teachers in Wales and Scotland considered their pupils to be ready at an earlier age than their colleagues in England. It is interesting to speculate whether there are any real differences in the children's degree of readiness or whether tradition or teacher training courses are responsible. Or perhaps a combination of these? Additionally, some of the Welsh children were Welsh-speaking and would have been taught to read in that language, which may lend itself to a more phonic approach than English.
Apart from the difference between the children in English schools and those in Wales and Scotland in relation to the age at which phonics were introduced, there is also evidence of more variability in the English and Welsh samples than in the Scottish. Both of these findings may be a reflection of more uniformity in Scotland, if this is the case, in the age of starting school.
Table 16
Age at which the Systematic Teaching of Phonics (i.e. Letter Sounds) was Commenced in SchoolN = 13,018
| England | Wales | Scotland |
| N | Per cent | N | Per cent | N | Per cent |
| Under 5 years of age | 357 | 3.7 | 78 | 11.6 | 26 | 1.9 |
| From 5 years to 5 years 5 months | 2,438 | 25.6 | 232 | 34.4 | 697 | 52.2 |
| From 5 years 6 months to 5 years 11 months | 3,134 | 32.9 | 153 | 22.7 | 541 | 40.6 |
| From 6 years to 6 years 5 months | 1,980 | 20.8 | 110 | 16.3 | 56 | 4.2 |
| From 6 years 6 months to 6 years 11 months | 1,069 | 11.2 | 63 | 9.3 | 9 | 0.7 |
| From 7 years to 7 years 5 months | 128 | 1.3 | 8 | 1.2 | 1 | 0.1 |
| Not commenced | 425 | 4.5 | 30 | 4.5 | 4 | 0.3 |
| Total information | 9,531 | 100 | 674 | 100 | 1,334 | 100 |
| Don't know | 1,293 | | 67 | | 108 | |
| No data | 9 | | 1 | | 1 | |
| GRAND TOTAL | 10,833 | | 742 | | 1,443 | |
Chi-squared (Trend) England and Wales =38.0; p < 0.001
Chi-squared (Trend) England and Scotland = 452.6; p < 0.001
[page 452]
Figure 2
Age at which the Systematic Teaching of Phonics (i.e. Letter Sounds) was Commenced in School
(English, Welsh and Scottish children in 'ordinary' maintained and independent schools)
N=13,018
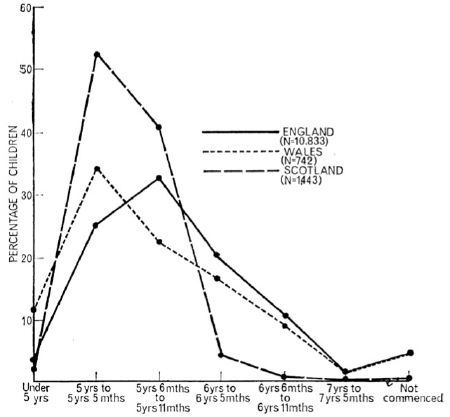
[page 453]
7. Age of Commencing 'Formal' Written Arithmetic
There have been considerable changes in many infant schools during recent years in the approach to number work. An increasing use of the term 'number work' or even 'mathematics' in place of 'arithmetic' or 'sums' is symptomatic of this change and the wider approach adopted in some schools. One accompaniment of the change has often been the introduction of 'formal' written arithmetic at a later stage.
Again, a comparison of the practice in England, Scotland and Wales is made. The results are presented in Table 17 and in graph form in Figure 3.
Table 17
Age at which 'Sums' (i.e. 'Formal' Written Arithmetic) was Introduced in SchoolN = 13,018
| England | Wales | Scotland |
| N | Per cent | N | Per cent | N | Per cent |
| Under 5 years of age | 78 | 0.8 | 24 | 3.5 | 4 | 0.3 |
| From 5 years to 5 years 5 months | 1,525 | 15.9 | 192 | 28.2 | 182 | 13.7 |
| From 5 years 6 months to 5 years 11 months | 4,073 | 42.5 | 245 | 36.0 | 825 | 61.9 |
| From 6 years to 6 years 5 months | 2,340 | 24.4 | 137 | 20.1 | 250 | 18.8 |
| From 6 years 6 months to 6 years 11 months | 1,007 | 10.5 | 57 | 8.4 | 62 | 4.7 |
| From 7 years to 7 years 5 months | 136 | 1.4 | 14 | 2.1 | 1 | 0.1 |
| Not commenced | 426 | 4.4 | 12 | 1.8 | 8 | 0.6 |
| Total information | 9,585 | 100 | 681 | 100 | 1,332 | 100 |
| Don't know | 1,239 | | 60 | | 110 | |
| No data | 9 | | 1 | | 1 | |
| GRAND TOTAL | 10,833 | | 742 | | 1,443 | |
Chi-squared (Trend) England and Wales = 54.0; p < 0.001
Chi-squared (Trend) England and Scotland = 96.8; p < 0.001
As in Table 16, there are a substantial number of 'Don't knows' and, for the same reason, discussed in the previous sub-section, they have been excluded from the percentaging.
In English schools pupils were introduced to 'sums' at a later age than their peers in Wales and in Scotland. The difference between the practice in the English and Welsh schools seems to centre on the fact that more of the children (approximately 32 per cent) in the latter schools had reached this stage before 5½ years of age than in England (approximately 17 per cent).
[page 454]
Figure 3
Age at which Children were Introduced to 'Sums' (i.e. 'Formal' Written Arithmetic) in School
(English, Welsh and Scottish children in 'ordinary' maintained and independent schools)
N=13,018
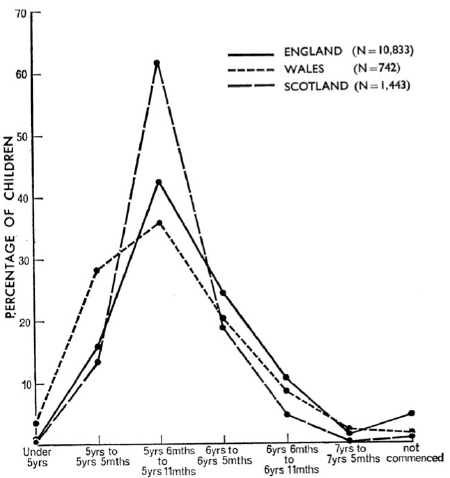
One apparent difference in practice among the Scottish schools as reflected in this sample of children is in their greater uniformity. Thus, although the peak period for the commencement of 'formal' written arithmetic was between 5 years 6 months and 5 years 11 months in all three countries, well over half (about 62 per cent) of the Scottish sample reached this stage during this six-month period, whereas in England and Wales the corresponding percentages were about 43 per cent and 36 per cent. This may be a reflection of more uniformity in Scotland, if this is the case, in the age of starting school.
[page 455]
8. Summary
(a) Whilst the majority of the children were at schools in which there was some form of organised contact between the school and the parents, most schools established these contacts without the framework of a parent/teacher association.
(b) About one third of the children attended schools in which the head teachers adopted the practice of allowing pre-school children to spend some time in the school before actually starting.
(c) The allocation of children to classes was done mainly on an age basis. It appeared that about half of the children were in classes where an attempt had been made to achieve a degree of homogeneity by some form of selective grouping, based on age within the year group, on ability or by some other arrangement. Only seven per cent of the children were in 'streamed' classes.
(d) The results indicated that of those children who had had no nursery schooling nearly half started school when they were aged 4 years 6 months to 4 years 11 months; the great majority of these would have commenced at the beginning of the term in which they attained the age of five. The mothers' reports showed that over 43 per cent of the children commenced school at the beginning of the following term. The school year 1962-63 may have been untypical because of the particularly acute shortage of teachers due to the lengthening of the teacher training college courses at that time.
(e) A comparison was made between the practice in England and that in Wales and in Scotland in relation to the age at which the systematic teaching of 'phonics' was commenced with these children and also the age at which 'sums' or 'formal' written arithmetic was introduced. The evidence was that pupils in English schools are introduced to both these aspects of their school work at a later age than those in Wales and Scotland. In all three countries a majority of the children had commenced 'formal' written arithmetic and were receiving some systematic teaching of 'phonics' before the age of six. There was also evidence of more uniformity of practice in Scotland than in Wales or England in both these spheres.
(f) In varying degrees all the questions here discussed have relevance to the educational development of children; it is therefore somewhat surprising that there is an almost complete lack of comparable information from other sources, particularly on a national basis. Such information is relatively straightforward to collect; moreover, if gathered at regular intervals it would be valuable to individual schools and teachers, to administrators and to those with responsibility for the training of teachers; also it would reflect changing practice and act as a stimulus to further change.
References
PIDGEON DA Date of Birth and Scholastic Performance, Educational Research, Vol. VIII, No.1 (National Foundation for Educational Research) (1965).
PIDGEON DA and DODDS EM Length of Schooling and its Effect on Performance in the Junior School, Educational Research, Vol. III, No. 3 (1961).
[page 456]
C. MEDICAL AND PHYSICAL FACTORS
NOTE. Most of the tables from which the summary tables in this and the following sections are derived are excluded from this version. They are given in full in Appendix I to the full version.
1. Introduction
This part of the Study is concerned with some aspects of the physical and medical status of the sample children. The information contained in this and in the following section (VD) is based upon data from approximately 8,000 Parental and Medical Questionnaires received by the middle of August 1965. The total number of children for whom information is available differs slightly in different tables. This is due to certain minor technical considerations, including the fact that the data in this and the following two sections were divided among four different punched cards. The data were derived from a general and systemic medical history gathered from the mother and from the results of examinations by school medical officers.
(a) Medical History
The design of this part of the enquiry is discussed in Section IIID. Information was sought on a wide variety of conditions and recorded on a pre-coded form. A positive reply to a question on whether the child suffered from a given condition led the interviewer to ask about age of onset, recent history or other specified details. These data are sometimes retrospective and with attendant possibility of bias. These considerations are discussed in more detail in the Introduction to Section VE: 'Medical and Developmental Sex Comparisons'.
(b) Medical Examination
A special problem was posed in the design of the Medical Questionnaire on which the results of the medical examination were to be recorded. It is known that analysis of school medical records yields gross fluctuations in incidence, suggesting very wide variations in interpretation. The pattern of the questionnaire, therefore, differed from that used for routine school records, though every effort was made to avoid complicated format. The medical practitioners who conducted the examinations consisted almost entirely of school medical officers, who are probably more experienced in technique of routine examination of children than any other section of the medical profession. With the exception of certain tests of special senses, it was therefore unnecessary to specify the manner in which the clinical examination should be carried out. The specially framed questions provided an objective determination of the current physical and medical status of the children. Any enquiry asking only for defects or abnormal findings to be noted would have allowed preconceived notions of normality to govern the decision whether or not an observation should be recorded. Therefore, within each system the medical examiner was asked to indicate a positive or negative response to the presence of specified conditions. Care was taken as far as possible to avoid questions inviting varying interpretations or subjective responses. For many specified conditions further details were enquired for special analysis. The doctor was also asked to comment upon any residual abnormality in each system examined.
In the main, therefore, facts rather than opinions were sought. However, clinical assessments were also included in certain fields, notably the special
[page 457]
senses, to allow subsequent comparison with test results. Specific tests of special senses, laterality or co-ordination were mostly derived from existing tests of proven value in clinical practice. In order to maximise comparability of results among a large number of examiners it was necessary to define the conditions of special tests in detail on the questionnaire.
(c) Interpretations
The medical and physical data on this incomplete sub-sample justify only tentative conclusions. For instance, it is known that the children involved in these 'early returns' are biased in family occupational group compared with 'late returns'. Moreover, those 'early returns' with Parental and Medical assessments show better reading and social adjustment than children for whom only educational information was available (see Section II: 'Description of the Sample '). Although the overall bias is not marked, it may become relevant when individual incidences or distributions in this sub-sample of 'early returns' are considered. Bias would be particularly important if a given physical factor is not associated with normal social circumstances, educational progress or behaviour and adjustment. Time has not permitted a comparison of the sub-sample of 'early returns' with the 'late returns' for any medical or physical factors. The possibility exists, for example, that the sub-sample does not contain a representative proportion of physically handicapped children. The present Report, therefore, deals with tests of special senses and with incidences of minor physical abnormality rather than with severe handicaps or major conditions requiring special treatment or education. A later report will present physical data, including height and weight, correlations between current physical status and perinatal information obtained on the children at birth from the Perinatal Survey of the National Birthday Trust Fund, and also relationships between current educational and medical status of the cohort.
2. Speech
(a) Introduction
Information was sought from the mother on a number of speech difficulties to which the child might have been subject; and the medical examiner used a speech test, noted any stammer and assessed the intelligibility of the child's speech.
(b) History and Examination
The results of the history and examination are summarised in Table 18.
Table 18
Speech: Summary of History and ExaminationNumber of boys = 4,053; Number of girls = 3,933; Total = 7,986
| Incidence per cent | Sex difference |
| Boys | Girls | Total | Chi-squared
(1 d.f.) | P value |
| History of stammer or stutter | 7.9 | 4.5 | 6.2 | 40.2 | < 0.001 |
| History of any other speech difficulty | 11.5 | 8.5 | 10.0 | 20.0 | < 0.001 |
| Any stammer observed on examination | 1.3 | 0.8 | 1.1 | 4.9 | 0.05 > p >0.01
not sig. |
| Speech not fully intelligible on testing | 16.2 | 11.4 | 14.0 | 39.5 | < 0.001 |
[page 458]
The superiority of girls over boys in speech function is amply demonstrated in the above table. Three of the sex differences are highly significant and the fourth is in the same direction, although it fails to reach the one per cent level of significance.
Fewer girls than boys were reported to have attended Speech Therapy Clinics (Table A33: Appendix I), again suggesting superior speech function. However, both this sex difference and that in 'history of other speech difficulty' (Table 18) may simply have resulted from later speech development in boys, since more girls were reported by their mothers to have been talking (i.e. 'joining two words') by the age of two years (Boys 92.4 per cent; Girls 95.2 per cent).
The overall incidence as opposed to sex comparisons of speech difficulty in Table 18 should be regarded with particular caution in view of the retrospective nature of the information and any bias in this sub-sample.
It should also be noted that in the great majority of children in whom some stammer was observed, the handicap was slight; and likewise for any lack of intelligibility on testing of speech.
(c) Speech Test
The sentences used in this speech test were composed of words chosen to demonstrate the commonest defects of speech in children (Sheridan, 1945, 1965). When applied by a large number of medical examiners the test can be expected to produce somewhat less reliable results than it would in the hands of those with specialised knowledge of speech development.
Table 19
Speech Test Results
| Mispronounced words | 11 | 10 | 9 | 8 | 7 | 6 | 5 | 4 | 3 | 2 | 1 | 0 |
| Cumulative frequencies: |
| Boys | 78 | 109 | 136 | 174 | 242 | 314 | 448 | 643 | 942 | 1467 | 2175 | 4008 |
| Girls | 43 | 65 | 87 | 117 | 153 | 224 | 305 | 442 | 684 | 1148 | 1906 | 3868 |
| Cumulative percentages: |
| Boys | 1.9 | 2.7 | 3.4 | 4.3 | 6.0 | 7.8 | 11.2 | 16.0 | 23.5 | 36.6 | 54.0 | 100 |
| Girls | 1.1 | 1.7 | 2.2 | 3.0 | 4.0 | 5.8 | 7.9 | 11.4 | 17.7 | 29.7 | 49.3 | 100 |
Chi-squared (Trend) = 30.6; p < 0.001
Six sentences were used in the test. The child was asked to repeat each one after the examiner, who noted any mispronounced words and recorded the total number of errors.
Cumulative percentages are shown in Table 19 and presented in graph form in Figure 4. Both the table and the figure are based upon the children (N= 7,876) for whom this information was available when the data were processed.
A trend test for sex difference in the proportion of mispronounced words in Table 19 confirms a superior performance in girls.
[page 459]
Figure 4
Speech Test
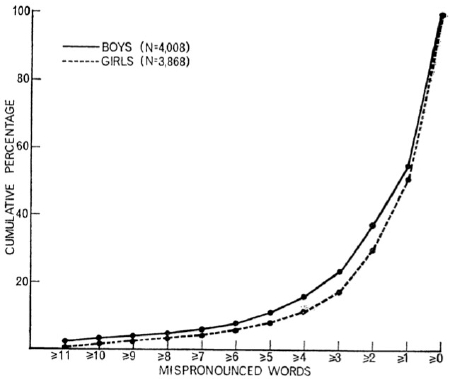
3. Vision
(a) Introduction
Information presented here on the children's vision includes the results of visual acuity testing, of a reported history of squint, of evidence of squint on examination and of a clinical assessment by the examining doctor of the severity and educational implications of any observed visual defects.
One objective of the present Study was to obtain representative national figures using defined procedures, although it was an inevitable drawback that many examiners had to be used. Later it is hoped to present fresh methods of classification, as published figures suggest gross variability in the way visual defect is assessed and reported. Thus, the incidences quoted by individual local authorities for visual defects in school children of all ages ranged in 1963 from 1.38 per cent to 25.2 per cent (HMSO, 1964). In 1961 (HMSO, 1962) the reported incidence of squint varied from 0.045 per cent to 10.6 per cent.
(b) Visual acuity
A standard Snellen test chart of block capitals was specified for the vision test and instructions were given in the Questionnaire on the conditions of the test as well as for the procedure to be adopted when a child did not know the letters in the chart. Each eye was tested separately without glasses and also with glasses if these were worn.
Table 20 shows the visual acuity in each eye of all the children in this sample for whom this information was available when tested without glasses. The
[page 460]
number of children for whom results are presented differs very slightly for the right eye and the left in Table 20 and in the following two tables due to difficulties in processing the data.
A sex difference was tested for each eye separately and the results were as follows:
Left eye
Chi-squared (Trend) = 0.5; p>0.05 not significant
Chi-squared (Departure) = 7.5 (6 d.f.); p>0.05 not significant
Right eye
Chi-squared (Trend) = 0.0; p>0.05 not significant
Chi-squared (Departure) = 6.2 (6 d.f.); p>0.05 not significant
As will be seen, no significant sex differences were found.
Table 20
Uncorrected Vision (i.e. without glasses)(All children)
| Right eye | Left eye |
Cumulative
frequencies | Cumulative
percentages | Cumulative
frequencies | Cumulative
percentages |
| Less than 6/60 or blind | 13 | 0.2 | 8 | 0.1 |
| 6/60 and less | 34 | 0.4 | 27 | 0.3 |
| 6/36 and less | 78 | 1.0 | 67 | 0.8 |
| 6/24 and less | 139 | 1.8 | 135 | 1.7 |
| 6/18 and less | 236 | 3.0 | 246 | 3.1 |
| 6/12 and less | 440 | 5.6 | 454 | 5.7 |
| 6/9 and less | 1,319 | 16.7 | 1,333 | 16.9 |
| 6/6 and less | 7,916 | 100 | 7,897 | 100 |
| Percentage with 6/6 vision = 83.4 | Percentage with 6/6 vision = 83.2 |
Table 21
Vision of Children who never wear glasses
| Right eye | Left eye |
Cumulative
frequencies | Cumulative
percentages | Cumulative
frequencies | Cumulative
percentages |
| Less than 6/60 or blind | 6 | 0.1 | 3 | 0.04 |
| 6/60 and less | 11 | 0.2 | 8 | 0.1 |
| 6/36 and less | 28 | 0.4 | 18 | 0.2 |
| 6/24 and less | 55 | 0.7 | 45 | 0.6 |
| 6/18 and less | 105 | 1.4 | 94 | 1.3 |
| 6/12 and less | 248 | 3.3 | 250 | 3.4 |
| 6/9 and less | 1,018 | 13.7 | 979 | 13.3 |
| 6/6 and less | 7,434 | 100 | 7,368 | 100 |
Table 20 shows that 17 per cent of all the children tested had sub-optimal visual acuity in the right eye, taking 6/6 as perfect vision. A similar proportion had sub-optimal vision in the left eye, but the degree of overlap is not yet known.
[page 461]
However, Table 20 does not distinguish between those children who already had glasses prescribed and those who had never worn glasses. The test results of the children who had never worn glasses are therefore shown in Table 21.
Table 21 shows that over 13 per cent of children who did not wear glasses had at least one eye with visual acuity below the optimum, taking 6/6 as perfect vision.
If 6/9 vision is considered acceptable, only three per cent of these children are shown to have imperfect vision in at least one eye, but some authorities would not be prepared to accept 6/9 vision as normal in a child until an examination by an ophthalmologist or ophthalmic optician had shown that an eye defect had been excluded.
Table 22
Corrected Vision of Children wearing glasses
| Right eye | Left eye |
Cumulative
frequencies | Cumulative
percentages | Cumulative
frequencies | Cumulative
percentages |
| Less than 6/60 or blind | 4 | 1.1 | 0 | 0 |
| 6/60 and less | 5 | 1.4 | 0 | 0 |
| 6/36 and less | 10 | 2.8 | 12 | 3.3 |
| 6/24 and less | 19 | 5.3 | 23 | 6.3 |
| 6/18 and less | 39 | 10.8 | 55 | 15.1 |
| 6/12 and less | 91 | 25.2 | 95 | 26.1 |
| 6/9 and less | 182 | 50.4 | 193 | 53.0 |
| 6/6 and less | 361 | 100 | 364 | 100 |
In those children tested wearing their glasses, the testing of the right eye showed sub-optimal vision in just over 50 per cent, and results for the left eye were similar. It may be that some children were tested wearing glasses which were intended for close work or reading, but the figures suggest that it would be a wise precaution for teachers to consider any child wearing glasses in a primary school to have defective vision and to place that child near the front of the class.
(c) Squint
A history of squint or of suspected squint obtained from the mother was recorded in the Parental Questionnaire. A manifest squint observed by the examining doctor was recorded and two tests were specified to enable him to detect the presence of a latent squint, i.e. a tendency to squint which is, in normal circumstances, kept under control. The type of squint (divergent or convergent) and the eye affected were also recorded for later analysis.
The teacher and school medical officer are favourably placed to pick out a child with this condition at school, but squint may derive from a number of causes dating from before birth to any time thereafter. Early detection of squint and other visual defects in the pre-school child is dependent upon the powers of observation of the mother and the use she might make of her general practitioner and the child welfare facilities. Neglect of a severe squint, or other visual defect, may result in the sight of an affected eye becoming permanently impaired.
[page 462]
The results of the history and examination are shown in Table 23 in summary.
Table 23
SquintNumber of boys = 4,058; Number of girls = 3,927; Total = 7,985
| Incidence per cent | Sex difference |
| Boys | Girls | Total | Chi-squared
(1 d.f.) | P value |
| History of squint or suspected squint | 6.4 | 6.1 | 6.3 | 0.3 | > 0.05 not sig. |
| Squint found on examination | 3.2 | 3.0 | 3.1 | 0.3 | > 0.05 not sig. |
| Latent squint on examination | 2.4 | 3.4 | 2.9 | 6.8 | 0.01 > p >0.001 |
It will be seen from Table 23 that approximately six per cent of the children had either a latent or manifest squint on examination. The significantly greater percentage of latent squints in girls is an unexpected finding. There was no difference between the sexes for manifest squint or for a history of squint or suspected squint.
(d) Visual Assessment
On completing the examination of the eyes and after the eye test, the medical officers were asked to rate the educational implications of any visual defect. This was done on a five-point scale, but in Table 24 all children who received anyone of the lowest three ratings are aggregated. The numbers with these ratings were very small and it was felt unwise to consider them as separate groups until time permits individual scrutiny of the questionnaires.
This crude breakdown was also considered advisable because many of the medical examinations were undertaken in clinics and the medical officers may have had no opportunity to discuss detailed educational difficulties arising out of any visual defect with school staffs.
Table 24
Visual Assessment
| Boys | Girls | Total | Total incidence
per cent |
| Normal vision | 3,453 | 3,325 | 6,778 | 86.2 |
| Visual defect, but judged to be no handicap to normal schooling and everyday activities | 541 | 522 | 1,063 | 13.5 |
| Visual defect judged to be a handicap in school in some degree (including blindness) | 10 | 8 | 18 | 0.3 |
| Total assessed | 4,004 | 3,855 | 7,859 | 100 |
| Don't know | 38 | 47 | 85 | |
| No data | 11 | 15 | 26 | |
| GRAND TOTAL | 4,053 | 3,917 | 7,970 | |
Sex difference: Chi-squared (Normal vision: Any visual defect) = 0.0 (1 d.f.) not significant
[page 463]
It will be seen that there is no significant sex difference.
This assessment serves to identify the 14 per cent of children judged to have some visual handicap. Thus, it is an assessment of function and it cannot fully take into account all the degrees of visual acuity shown in Tables 20, 21 and 22.
4. Hearing
(a) Introduction
The testing and assessment of the children's hearing included a pure-tone audiogram; a functional assessment of hearing by the examining doctor; a clinical hearing test; and any reported history of hearing difficulty or attendance at an audiology clinic. Time has not yet permitted any analysis of the audiograms.
(b) Assessment of Hearing
A functional assessment of hearing was carried out by the school doctor after he had completed the examination and hearing test. The assessment was made on a four-point scale and the definitions at each point on the scale were framed to correspond approximately to the statutory definitions of deaf and partially hearing children.
In view of the small number of children who were assessed as having some degree of auditory handicap and the impossibility of scrutinising the questionnaires individually to confirm the appropriate category, it was decided to group together all such children. The purpose was to compare them with those judged to have 'normal hearing'. The results are shown in Table 25, in which children with 'some degree of hearing impairment' include those with hearing loss which had been corrected by a hearing aid; those whose understanding of speech was impaired (even with a hearing aid); and those whose hearing disability was so severe that they could not understand speech at all. The proportion of children in the present sub-sample who fell into the latter two categories was 0.1 per cent.
Table 25
Assessment of Hearing
| Boys | Girls | Total |
| N | Per cent | N | Per cent | N | Per cent |
| Normal hearing | 3,810 | 95.1 | 3,684 | 95.2 | 7,494 | 95.1 |
| Some degree of hearing impairment | 199 | 4.9 | 185 | 4.8 | 384 | 4.9 |
| Total assessed | 4,009 | 100 | 3,869 | 100 | 7,878 | 100 |
| Don't know | 33 | | 34 | | 67 | |
| No data | 11 | | 14 | | 25 | |
| GRAND TOTAL | 4,053 | | 3,917 | | 7,970 | |
Chi-squared = 0.1 (1 d.f.); p > 0.05 not significant
The difference between the sexes on this assessment is not significant. A little under five per cent of the children in this sub-sample were judged by the medical officers to have some degree of hearing impairment.
[page 464]
(c) Hearing Test
The hearing test consisted of twelve test words which the child was required to repeat one by one after the examiner. The test conditions were specified in detail in the questionnaire. The twelve words were selected to test the auditory acuity over the speech frequency range (Sheridan, 1958 and 1965). A preliminary analysis of the results is presented in the following table.
Table 26
Hearing TestNumber of boys = 4,053; Number of girls = 3,917; Total = 7,970
Test words
Score of
errors | Right ear | Left ear |
| Cumulative Percentages |
| Boys | Girls | Boys | Girls |
| 9 or more | 0.6 | 1.0 | 0.8 | 0.9 |
| 8 or more | 0.8 | 1.1 | 0.9 | 1.1 |
| 7 or more | 1.0 | 1.1 | 1.1 | 1.3 |
| 6 or more | 1.3 | 1.3 | 1.3 | 1.6 |
| 5 or more | 1.7 | 1.6 | 1.8 | 2.1 |
| 4 or more | 2.4 | 2.6 | 2.8 | 3.0 |
| 3 or more | 3.9 | 3.9 | 5.1 | 4.6 |
| 2 or more | 10.7 | 9.7 | 11.2 | 9.9 |
| 1 or more | 28.9 | 25.4 | 28.4 | 26.3 |
| 0 or more | 100 | 100 | 100 | 100 |
Percentage
with no errors | 71.1 | 74-6 | 71.6 | 73.7 |
Sex differences:
Chi-squared (Trend): left ear = 0.8; p > 0.05 not significant
Chi-squared (Trend): right ear = 1.9; p > 0.05 not significant
There were no significant sex differences on the results of this hearing test for each ear separately.
It will be seen that some four to five per cent of the children, for each ear separately, failed to repeat three or more words of the twelve used. A functional assessment by the examining doctor (Table 25) indicated also that five per cent of the children had some degree of hearing impairment. Some further analysis will be necessary to determine any correlation between the two, test and assessment, and their relationship to audiometry results.
In the hearing test a poor understanding of the meaning of words or an inability to concentrate may adversely affect the score of a child with a minor degree of hearing loss. Conversely, a bright child will be at an advantage in coping with a loss of auditory acuity. The audiogram and the clinical hearing test are therefore complementary in the assessment of hearing.
The test was developed from one which was originally designed for individual specialist use. Its application to the children in this Study may, after further analysis, establish its value as an additional screening test for use in conjunction with existing pure-tone audiometric screening methods.
[page 465]
(d) History of Hearing Difficulty and Clinic Attendance
Table 27
History of Hearing Difficulty and Clinic AttendanceNumber of boys = 4,059; Number of girls = 3,926; Total = 7,985
| Incidence per cent | Sex difference |
| Boys | Girls | Total | Chi-squared
(1 d.f.) | P value |
| Hearing difficulty suspected or confirmed | 10.9 | 9.5 | 10.3 | 4.3 | 0.05 > p > 0.01
not sig. |
| Attendance at a hearing or audiology clinic | 8.1 | 7.8 | 7.9 | 0.2 | > 0.05
not sig. |
The results of the analysis showed no significant sex differences.
Some 10 per cent of the children in this sub-sample were reported by their mothers to have had a suspected or confirmed hearing difficulty at any time in the first seven years of life. Numbered amongst these will be children who had a temporary catarrhal deafness following a cold; those whose lack of attention or responsiveness had led to a suspicion of hearing difficulty; and those whose hearing might have been shown with certainty to be impaired. Approximately eight per cent of the children were reported to have attended hearing or audiology clinics. These children would include a considerable number who had been sent for routine audiometry as a result of doubtful screening tests of hearing at school. On retesting, the majority of the children are found to be normal. The figure of eight per cent does, however, give some indication of the amount of work undertaken by audiology clinics.
5. Laterality
(a) Introduction
The school child who is left-handed differs from the majority of his fellows. In the past, attempts were made by parents and teachers to correct left-handed tendencies in what was then thought to be the best interests of the child. The modern attitude is more permissive. The large number of theories on handedness merely reflect the uncertainty about its origins and its implications. Hereafter in this section, the term 'handedness' is confined to the mother's opinion on the child, and 'laterality' is used to describe the results of the tests.
Results on handedness and tests of laterality will be analysed in the Study for three main purposes:
(i) to determine the pattern of right or left dominance and mixed laterality in this cohort;
(ii) to investigate whether any of these tendencies are associated with educational, emotional or other handicap;
(iii) to establish any relationship with events occurring in pregnancy or the perinatal period.
Preliminary results are presented here on the first of these items.
[page 466]
(b) Handedness - Mothers' Information
The mothers were asked whether their child was right-handed, left-handed or mixed right-handed and left-handed. The results are shown in Table 28.
Table 28
Handedness (Mothers' Information)Number of boys = 4,058; Number of girls = 3,927; Total = 7,985
| Right-
handed | Left-
handed | Mixed-
handed | Total | Don't
know | No
data |
| Boys |
| Number | 3,227 | 455 | 351 | 4,033 | 5 | 20 |
| Per cent | 80.0 | 11.3 | 8.7 | 100 | | |
| Girls |
| Number | 3,337 | 344 | 230 | 3,911 | 6 | 10 |
| Per cent | 85.3 | 8.8 | 5.9 | 100 | | |
| TOTAL |
| Number | 6,564 | 799 | 581 | 7,944 | 11 | 30 |
| Percent | 82.7 | 10.1 | 7.3 | 100 | | |
Sex differences:
Chi-squared (Left-handed: Right-handed and Mixed-handed) = 13.6 (1 d.f.); p < 0.001
Chi-squared (Mixed-handed: Right and Left-handed) = 23.3 (1 d.f.); p < 0.001
The evidence from the analysis is that, as reported by mothers, more boys than girls are left-handed and also more boys are mixed-handed.
(c) Tests of Laterality
The pattern of limb-dominance or eye-dominance is not necessarily invariable for any one person but may depend upon the activity or task which is undertaken. Thus, 'mixed-handedness' reported by the mother (Table 28) will in most cases refer to the child's ability or preference to use different hands for different purposes.
During the medical examination tests were used to determine the hand, foot and eye which was used by each child in specific tasks. The examiner was asked to record for the two tasks involving the use of the hand and arm whether only the right hand was used; only the left hand; or, both right and left hands. Similarly, a record was made of the preferred foot and eye.
In Table 29 the results of these tests are presented separately for hand, foot and eye. On the basis of their performance in the tests, the children were allocated to one of three groups: 'Right' (when only the right hand, foot or eye was used); 'Left'; or 'Mixed' laterality. The categories to which the children have been allocated should be seen in terms of the type and number of tasks set. For example, had more tests been used, the number of 'mixed-laterals' may have been somewhat higher. In testing for sex differences, therefore, 'mixed-laterals' were excluded.
The results show that more boys than girls show a preference for using the left hand, left foot or left eye in terms of the tasks specified. The percentage figures relate only to these particular tests and, in any case, should be regarded as provisional at the present stage. Approximately one third of the
[page 467]
Table 29
Laterality TestsNumber of boys = 4,053; Number of girls = 3,917; Total = 7,970
| Right | Left | Mixed | Total | Don't
know | No
data |
| HAND |
| Boys |
| Number | 3,202 | 353 | 485 | 4,040 | 9 | 4 |
| Per cent | 79.3 | 8.7 | 12.0 | 100 | | |
| Girls |
| Number | 3,143 | 237 | 527 | 3,907 | 8 | 2 |
| Per cent | 80.0 | 6.1 | 13.5 | 100 | | |
| TOTAL |
| Number | 6,345 | 590 | 1,012 | 7,947 | 17 | 6 |
| Percent | 79.8 | 7.4 | 12.7 | 100 | | |
| FOOT |
| Boys |
| Number | 2,235 | 329 | 1,464 | 4,028 | 12 | 13 |
| Percent | 55.5 | 8.2 | 36.3 | 100 | | |
| Girls |
| Number | 2,330 | 234 | 1,333 | 3,897 | 13 | 7 |
| Percent | 59.8 | 6.0 | 34.2 | 100 | | |
| TOTAL |
| Number | 4,565 | 563 | 2,797 | 7,925 | 25 | 20 |
| Percent | 57.6 | 7.1 | 35.3 | 100 | | |
| EYE |
| Boys |
| Number | 2,303 | 1,418 | 314 | 4,035 | 13 | 5 |
| Per cent | 57.1 | 35.1 | 7.8 | 100 | | |
| Girls |
| Number | 2,343 | 1,259 | 301 | 3,903 | 12 | 2 |
| Percent | 60.0 | 32.3 | 7.7 | 100 | | |
| TOTAL |
| Number | 4,646 | 2,677 | 615 | 7,938 | 25 | 6 |
| Percent | 58.5 | 33.7 | 7.7 | 100 | | |
Sex differences:
Hand
Chi-squared Right: Left (excluding 'Mixed laterals') = 18.9 (1 d.f.) p < 0.001
Foot
Chi-squared Right: Left (excluding 'Mixed laterals') = 18.0 (1 d.f.) p < 0.001
Eye
Chi-squared Right: Left (excluding 'Mixed laterals') = 7.9 (1 d.f.) 0.01 > p > 0.001
children showed no clear foot preference and 58 per cent were right-footed. One third showed left eye dominance. Although the incidence of left-hand laterality shown by testing was not as high as left-handedness reported by mothers, it remains higher than that shown by many other workers.
6. Dental Examination
(a) Introduction
The medical examination of the 1958 cohort provided the opportunity to assess the state of children's teeth at the stage of transition from infant school to junior school on a national scale, though it was realised that such an inspection carried out by doctors could not achieve the same degree of accuracy as that undertaken by dental officers.
[page 468]
The index of dental caries used - the total number of decayed, missing and filled teeth - provides a basis for comparison with existing figures and allows possible associations with other factors to be sought at a future date.
A record of the number of decayed, missing or filled teeth has the added advantage that it allows some assessment of the amount of dental decay more or less independent of the dental treatment. However, this index does not make separate allowance for naturally shed teeth which, at the age of seven years, is a relevant factor.
For the purpose of comparison, figures for Nottinghamshire in 1963 (HMSO, 1964) are reproduced in Table 30, since they show the sexes separately.
Table 30
Dental Decay (Nottinghamshire, 1963)N = 1,435
(b) Dental Decay
| Percentage
of children
showing no
DMF* teeth | Average number
of DMF* teeth
per child
examined |
| Boys | Girls | Boys | Girls |
| 5 year age group | 28.0 | 22.8 | 4.1 | 4.0 |
| 12 year age group | 6.8 | 5.4 | 4.0 | 4.1 |
*Decayed, missing and filled.
The results of the dental examination of the present sub-sample are shown in Table 31 for those children for whom this information is available.
Table 31
Dental DecayN = 7,928
| Percentage
of children
showing no
DMF* teeth | Average number
of DMF* teeth
per child
examined |
| Boys | Girls | Boys | Girls |
| 7 year age group | 12.7 | 12.3 | 4.7 | 4.6 |
It will be seen that the percentage of children with no decayed, missing or filled teeth in the present sub-sample lies between the figures quoted for five year olds and 12 year olds in Nottinghamshire (Table 30). Inspection of Table 31 suggests no sex difference, and there is further evidence of this when analysis is carried out on the full distribution of DMF teeth in the sample (Table 32). These results are shown in graph form in Figure 5.
The provisional figures shown in Appendix 1, Table A33, show that some three quarters of the sub-sample were reported to have attended, at some time in the past, a dental clinic, dental surgeon or orthodontist. A more significant point, perhaps, might be that nearly a quarter of the children were
[page 469]
reported as not having made use of these facilities in spite of the availability of a school dental service and a free personal dental service. Both these services are already overworked, and if the needs indicated by the present findings are to be met, clearly a reappraisal of dental establishment is required.
Table 32
Dental DecayNumber of boys = 4,029; Number of girls = 3,899; Total = 7,928
Appendix 10 Table 32 Dental decayNumber of boys = 4,029; Number of girls = 3,899; Total = 7,928
Number of
decayed,
missing and
filled teeth | 13+ | 12+ | 11+ | 10+ | 9+ | 8+ | 7+ | 6+ | 5+ | 4+ | 3+ | 2+ | 1+ | 0+ |
| Cumulative percentages:
|
| Boys | 2.8 | 4.4 | 6.4 | 9.9 | 14 | 21 | 29 | 38 | 48 | 60 | 69 | 79 | 87 | 100 |
| Girls | 1.8 | 3.3 | 5.2 | 8.2 | 13 | 20 | 27 | 37 | 47 | 59 | 69 | 80 | 88 | 100 |
Sex differences:
Chi-squared (Trend) = 0.06; p > 0.05 not significant
Chi-squared (Departure) = 18.0 (11 d.f.); p > 0.05 not significant
Figure 5
Dental Decay
N=7,928
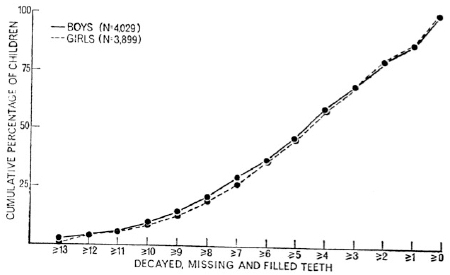
7. Micturition and bowel control
(a) Introduction
In obtaining information about micturition and bowel control, as for other developmental milestones, retrospective inquiry from each mother as to the age at which these milestones were reached would have very limited value.
[page 470]
Instead, an age was chosen at which it was known that the great majority of children would have achieved bladder or bowel control and the mothers were asked whether their child had achieved control by this time. Though answers obtained would still not be without a measure of unreliability, the major aim was not to establish norms for these facets of development. It was rather to identify those children who had reached these milestones later than the majority of their peers so that these facets could be related to other aspects of health and development; and also so that a comparison could be made between the sexes in these respects.
(b) Micturition and Bowel Control by Day
Two questions were put to mothers about micturition and bowel control by day. The results are summarised in Table 33.
Table 33
Micturition and Bowel Control by DayNumber of boys = 4,059; Number of girls = 3,926; Total = 7,985
| Incidence per cent | Sex difference |
| Boys | Girls | Total | Chi-squared
(1 d.f.) | P value |
| Wet by day after 3 years | 4.4 | 4.3 | 4.4 | 0.1 | > 0.05
not sig. |
| Soiled by day after 4 years | 1.8 | 0.6 | 1.2 | 22.1 | < 0.001 |
The percentage of boys and girls who were reported to have wet themselves in the daytime over the age of three years is similar; approximately 4.4 per cent.
The response to the second question suggested that 1.8 per cent of boys and 0.6 per cent of girls had not achieved bowel control by the age of four. The sex difference is highly significant.
In replying to the above questions, the mother was told to ignore the occasional mishap. However, the problems of wetting and soiling are clearly not likely to be great, even in nursery schools or classes.
(c) Bedwetting
The response in Table 34 suggests that bedwetting over the age of five years, even when occasional mishaps have been excluded, must be considered quite a common phenomenon, affecting some 11 per cent of children in this sample. As this question related to events occurring within two years of the Study, it is less likely to evoke unreliable replies than those concerning the earlier milestones.
More boys were reported to be wet at night after five years of age than were girls (12.1 per cent boys and 9.7 per cent girls). The difference between the sexes is highly significant.
[page 471]
Table 34
BedwettingNumber of boys = 4,059; Number of girls = 3,926; Total = 7,985
| Incidence per cent | Sex difference |
| Boys | Girls | Total | Chi-squared
(1 d.f.) | P value |
| Wet by night after 5 years | 12.1 | 9.7 | 10.9 | 11.4 | < 0.001 |
The figure of 11 per cent is high enough to merit further investigation. It may be that the age at which bladder control is normally attained extends over a greater range than is generally accepted.
References
DEPARTMENT OF EDUCATION AND SCIENCE The Health of the School Child 1962 and 1963 (HMSO) (1964).
MINISTRY OF EDUCATION The Health of the School Child 1960 and 1961 (HMSO) (1962).
SHERIDAN MD The Child's Acquisition of Speech, Brit. Med. J. i, p. 707 (1945).
SHERIDAN MD Simple Clinical Hearing Tests for Very Young or Mentally Retarded Children, Brit. Med. J. ii, pp. 999-1,004 (1958).
SHERIDAN MD Personal Communication, Paediatric Research Unit, Guy's Hospital, London (1965).
D. MEDICAL AND DEVELOPMENTAL SEX COMPARISONS
1. Introduction
In this section comparisons are made between boys and girls for incidence of some past illnesses, accidents, hospital admissions, attendance at specialist clinics; and for some data from the medical examination of the children at seven years of age.
The totals from which these comparisons are made should not be seen as more than estimates of incidence of illnesses or other factors in the whole cohort for a number of reasons. First, the cohort was not studied between birth and the present time; the historical data are thus retrospective. Secondly, it was gathered from parents and not from hospital or other records, although it is intended to obtain corroborative data from hospitals or clinics.
The possibility exists of differential parental recall on some items favouring one or other sex, but this is not likely to be an important source of bias. In this section the results of sex comparisons are summarised from tables which are contained occasionally in Section VC or in Appendix 1, Table A33. However, the majority of the tables on which sex comparisons are based have been omitted. These are published elsewhere.* Where comment is made on a sex difference in the text this is significant at a level of at least one per cent unless otherwise specified.
*PRINGLE MLK, BUTLER NR and DAVIE R 11,000 Seven-Year-Olds Longmans, Green & Co. Ltd.) (1966).
[page 472]
Mortality rates are known to be higher in boys than in girls; a greater male perinatal death rate was also found for the present cohort in the Perinatal Mortality Survey. It is therefore reasonable to expect that there should be greater childhood morbidity in males than in females, and these hypotheses can be tested for many illnesses and childhood conditions.
2. Accidents
The results on this sub-sample of children confirm the view that, in general, boys are more accident-prone than girls. Thus, a higher proportion of boys had had one or more hospital admissions for road accidents (Boys 3.0 per cent; Girls 1.7 per cent) and for all other accidents or injuries which had not occurred within the home (Boys 9.7 per cent; Girls 6.9 per cent). More boys, too, were reported as having had in the past a head injury with loss of consciousness (Boys 3.5 per cent; Girls 2.6 per cent). For home accidents, however, there was no significant difference between the sexes (Boys 9.9 per cent; Girls 8.8 per cent).
From these provisional figures it would appear that about three per cent of the boys had been admitted to hospital on one or more occasions for a road accident; as many as about 10 per cent had had an accident in the home severe enough to require hospital admission; and a similar proportion were reported to have been admitted to hospital for other accidents or injuries sustained outside the home. The corresponding figures for girls were still disconcertingly high, emphasising the need for increased concentration upon accident prevention in childhood.
3. Upper Respiratory Infections
Past upper respiratory infections showed no sex difference, as judged by a history of three or more ear infections during the year preceding the medical examination (Boys 12.8 per cent; Girls 13.9 per cent) or by a history of admission to hospital for tonsils and/or adenoids (Boys 15.3 per cent; Girls 15.7 per cent). On the other hand, current upper respiratory conditions did show a male preponderance in that the medical examinations revealed a higher proportion of boys with nasal obstruction (Boys 10.2 per cent; Girls 7.9 per cent) and some evidence of (0.05>p>0.01) more nasal or postnasal discharge (Boys 10.7 per cent; Girls 9.0 per cent) and enlarged glands in the neck (Boys 25.9 per cent; Girls 22.6 per cent); the mothers also reported that boys were more often habitual snorers and mouth breathers (Boys 26.0 per cent; Girls 22.0 per cent).
4. Psychosomatic and Behaviour Problems
A history of travel sickness was reported more frequently in girls than boys (Boys 18.3 per cent; Girls 29.2 per cent). There was also some evidence (0.05>p>0.01) of more frequent periodic abdominal pain in girls (Boys 14.0 per cent; Girls 15.7 per cent).
Boys more frequently showed a history of tics or habit spasms (Boys 5.9 per cent; Girls 4.4 per cent); breath holding, head banging or 'rocking' (Boys 9.7 per cent; Girls 7.3 per cent); and were more frequently reported to have attended child guidance clinics (Table A33).
No sex difference emerged in the history of frequent headaches or migraine (Boys 8.2 per cent; Girls 7.9 per cent), or in that of periodic vomiting or bilious attacks (Boys 17.0 per cent; Girls 17.5 per cent).
[page 473]
5. Convulsions
There was some evidence (0.05>p>0.01) that boys had had more fits in the first year of life (Boys 2.2 per cent; Girls 1.6 per cent), but there was not an excess of males with fits after one year (Boys 2.9 per cent; Girls 2.2 per cent) or with petit mal (Boys 0.5 per cent; Girls 0.8 per cent).
6. Allergic States
The objectivity of a history of asthma or eczema given by the mother is difficult to assess without confirmation. More boys were reported to have had asthma (Boys 3.6 per cent; Girls 2.3 per cent) or bronchitis with wheezing (Boys 19.4 per cent; Girls 15.9 per cent). There was no sex difference in history of eczema after one year of age (Boys 5.5 per cent; Girls 5.7 per cent), or of eczema on examination (Boys 2.8 per cent; Girls 2.7 per cent), or of a history of hay fever (Boys 5.9 per cent; Girls 5.2 per cent).
7. Speech
A history of stammer and of other speech difficulty was reported more often in boys; on examination, more boys were assessed as being not fully intelligible during speech testing and there was also some evidence (0.05>p>0.01) of a higher incidence of observed stammer (see VC, Table 18). Fewer boys were reported to have been 'talking' (i.e. joining two words) by the age of two years (Boys 92.4 per cent; Girls 95.2 per cent). It is not therefore surprising that more boys of seven years had already attended for speech therapy (Table A33).
8. Ophthalmological Conditions
There were no significant sex differences in a history of squint or suspected squint, nor of manifest squint on examination (Section VC, Table 23); further, no sex difference was found in those assessed by the medical officer to have a visual defect (Table 24). However, more girls than boys were found to have latent squint on examination (Table 23).
9. Auditory Conditions
A comparison of the sexes revealed no difference in the results of a clinical hearing test, in an assessment of hearing impairment by the medical examiners or in the proportion of boys and girls who had attended hearing or audiology clinics (Section VC, Tables 25, 26, 27). On examination there was no difference between boys and girls in the frequency with which signs of past or present otitis media were present.
A higher proportion of girls were reported by their mothers as having had earache in the first seven years of life (Boys 29.7 per cent; Girls 33.4 per cent).
10. Dental Status
At seven years of age, as judged by the number of decayed, missing or filled teeth, there was no sex difference (Section VC, Table 32) and no sex differential in past utilisation of dental services (Table A33). A minor finding was that a history of recurrent mouth ulcers was more frequent in girls (Boys 7.5 per cent; Girls 11.6 per cent).
11. Congenital Malformations
Sex differences were tested on a few congenital anomalies in this sub-sample. A history of 'port-wine stains' of the skin was commoner in girls (Boys
[page 474]
4.4 per cent; Girls 6.4 per cent) and there was some evidence of a similar sex difference (0.05>p>0.01) in the history of 'strawberry naevi' (Boys 4.4 per cent; Girls 5.4 per cent). On examination, 'birth marks' were reported more frequently in girls (Boys 11.2 per cent; Girls 13.8 per cent). There was also a preponderance of girls (Boys 0.05 per cent; Girls 0.3 per cent) with a history of congenital dislocation of the hip - although actual numbers were small - and some evidence (0.05>p>0.01) of a similar difference in the history of talipes (Boys 0.6 per cent; Girls 1.1 per cent). More boys were reported to show deformities of chest (Boys 3.3 per cent; Girls 1.7 per cent) and external ear (Boys 2.3 per cent; Girls 0.7 per cent).
12. Hernia
More boys than girls had a reported history of this condition and more had been admitted to hospital for hernia repair (Boys 2.7 per cent; Girls 1.0 per cent). This difference between the sexes was apparent, too, at the medical examinations, where more boys were reported by the medical officers to have inguinal hernia (Boys 0.8 per cent; Girls 0.1 per cent).
E. ENVIRONMENTAL FACTORS
1. Introduction
A comprehensive study of children's growth and development must include a study of home background. There is mounting evidence from investigations into the complex processes involved in a child's response to school (for example, Fraser, 1959; Floud, Halsey and Martin, 1957; Douglas, 1964; Wiseman, 1964) to indicate the vital importance of social factors in educational achievement and progress.
In this section some of the data which were collected about the home background of the children in the present sample are presented and discussed. Most of the information was obtained in interviews with mothers, but questions relating to school attendance and parents' interest in the child's education were answered by head teachers.
Only a fraction of the relevant information could be included in this section. A choice had to be made among the original factors selected for study, and it does not necessarily follow that because a topic is included here there are not others which may prove to be of equal, or possibly greater, importance that have been omitted. Within the limits of availability, items were chosen according to two criteria: first, their assumed importance and relevance to children's development; and, secondly, the likelihood of their being of special interest to the Central Advisory Council.
The material presented in this section is essentially of a descriptive nature. Time has not permitted many comparisons with other studies, but not infrequently other data were not available or were not strictly comparable. Within the sample, sex differences have been considered where relevant. The numbers of children included in the different tables will vary as follows:
10,833 - All children in 'ordinary' maintained and independent schools for whom data from the Educational Assessment booklet were available for sorting on punched cards. (See Introduction to Section V A: 'Educational Factors'.)
7 ,985 - All children with data from completed Parental Questionnaires available for sorting on punched cards, irrespective of their schooling.
[page 475]
In addition, some of the figures were abstracted from computer tables and totals will vary according to the number of cases where particular information was available. It should be noted that all totals from computer tables in this section include children known to be either in 'ordinary' or 'special' schools. These children whose type of school was not known, and the very few resident in hospital, are not included.
Much of the information contained in this section was derived from Parental Questionnaires; that is, for a sub-sample of 7,985 children.
The question of the representative nature of this sub-sample has been discussed elsewhere (Section II: 'Description of the Sample') and may be summarised as follows: first, there were no very marked differences between the social class distribution of the sub-sample and that of the national sample; such differences, as there were, are difficult to interpret. Secondly, a comparison of the social class distribution of the sub-sample with that of 'late returns' showed an overall significant difference, but did not indicate a consistent change in the social class distribution. Thirdly, the reading ability and social adjustment at school of the sub-sample was compared with that of the children for whom a Parental Questionnaire had not been received. Here there was statistically significant evidence that the children in the sub-sample were better readers and better adjusted than the children whose Parental Questionnaires had not been received.
The implications of this statistically significant but not marked bias in the sub-sample are that when information is derived from the Parental Questionnaires, any findings relating to adverse conditions are likely to underestimate the incidence of such circumstances in the total cohort.
2. Socio-Economic Status
Information was available about the occupations of the children's fathers or the male heads of households, both from the Perinatal Survey and from the present Study. This allowed the possibility of a choice between using current or past information for classification into socio-economic groups.
The value of using current information about the father's occupation lay in the nature of the material to be presented in the Report. Where perinatal data were to be linked with current data about the children, the arguments for and against using present or past information seemed fairly evenly balanced. But for much of the Report the educational, medical and social information presented and discussed was concerned directly with the children's development at the age of seven. For this, the use of father's present occupation was considered most relevant.
It was finally decided, therefore, to use the father's present occupation in all analyses of this Report which use the socio-economic status of the family as a variable.
Information about the occupation of each child's father, or the male head of household, was obtained from 7,723 of the 7,985 Parental Questionnaires which were completed and returned in time for analysis. Of the remaining 262 questionnaires, information about the father's occupation was incomplete or not available in 60 cases, and in 202 cases the children were living in households without a father or male head.
Each occupation was grouped initially in the five Social Class categories of the General Register Office's 'Classification of Occupations 1960'. The
[page 476]
proportions in each Social Class for the present sub-sample are shown in Table 38.
Table 38
Social Class Distribution(Children for whom Parental Questionnaires had been returned by August 1965)
| Social class categories | Present sample |
| N | Per cent |
| I Professional etc. occupations | 443 | 5.7 |
| II Intermediate occupations | 1,131 | 14.6 |
| III Skilled occupations | 4,387 | 56.8 |
| IV Partly skilled occupations | 1,322 | 17.1 |
| V Unskilled occupations | 440 | 5.7 |
| Total information | 7,723 | 100 |
| No male head of household | 202 | |
| No data | 60 | |
| GRAND TOTAL | 7,985 | |
A comparison has been made (see Section IIB: 'Description of the Sample') between the above distribution and that of a 10 per cent sample of married women in England and Wales, classified by their husbands' occupations (HMSO, 1966). The differences between the two distributions are not marked and may be due to the following factors: the present sample is of children and not of households; the data were gathered four years later; the present sample is only part of the 1958 cohort and does not include the data from Welsh children.
In order to check further on the representative nature of this sub-sample of 'early returns', a comparison was made between the Social Class distribution of this group and that of the 'late returns'. These two groups were also compared for reading ability and social adjustment in school (see Section lIB: 'Description of the Sample').
Some modification of the General Register Office's five Social Class categories was considered advisable for the purpose of socio-economic classification in this Report. Social Class I and II are grouped together, as it was considered that the distinctions between the two categories are minimal in this kind of analysis. On the other hand, in relation to many factors in social analysis including children's development, it has been found that many of the characteristics of workers in clerical and other non-manual occupations are not similar to skilled manual workers, but lie between professional workers and skilled manual workers. As the Registrar General's Social Class III includes both non-manual and the skilled manual occupations, it was decided to separate the skilled manual workers from the non-manual workers in Social Class III. It was not considered meaningful to separate the small proportion of non-manual from manual workers in Social Class IV. The resulting regrouping and nomenclature are shown in Table 68.
[page 477]
Table 39
Occupational Groupings Used in this Study
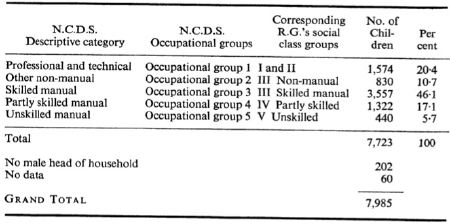 [click on the image for a larger version]
The above five occupational groups are the basis of the main socio-economic classifications used in this interim report. Although the father's occupation on its own must be considered a relatively crude index of a family's social, economic and cultural environment, nevertheless, there are meaningful distinctions in this kind of grouping which are highly relevant to children's development. Further information from the questionnaires is available on the social and economic circumstances of the children's families, both at the time of birth and at the age of seven. It is intended at a later stage to combine some or all of this data to provide a basis for a more sophisticated socio-economic classification.
The data from the questionnaires containing information about children with no male head of household are included in all tables in the Descriptive Statistics Section and in other sections of the Report where there is no occupational group breakdown. When there is an occupational group classification, this data had to be excluded and is shown on tables under the 'No data' columns; thus, it does not appear in the percentaged totals.
3. Family Structure
(a) Parental Situation
Table 40
Parental Situation
| N | Per cent |
| Living with both natural parents | 6,808 | 93.8 |
| Not living with both natural parents | 452 | 6.2 |
| TOTAL INFORMATION | 7,260 | 100 |
[page 478]
The second category in the above table covers all known situations where children were not being cared for by their own mothers and fathers. It includes those living with only one parent because of illegitimacy, desertion, divorce, separation or death; those with one step-parent as well as children who were adopted, fostered or in care. The very small number who live more or less permanently in hospitals, or similar institutions, are excluded.
At the time when the information was obtained, six per cent of the present sub-sample was living in a family or group situation which was different in one or more respects from the majority. It is, of course, difficult to assess the influence and weight of abnormal factors in a child's family situation. For example, a child living with his own parents, one of whom may be mentally or physically seriously ill, may well be growing up in an atmosphere of much greater stress than another child who has been successfully adopted or fostered. Nevertheless, a child not living with both his natural parents will, in many cases, have experienced a period of separation which may have been prolonged; in others, for example, one-parent families, the child may be permanently deprived of a normal home life. Thus, at some time or another he will probably have undergone an upsetting, if not seriously traumatic, experience.
There is considerable evidence from research findings (Lewis, 1954; Fraser, 1959; Wynn, 1964; Pringle, 1965; Roe, 1965) to show that in our society the lives of children from incomplete or broken families are adversely affected by a combination of circumstances; these extend not only to emotional but also to social and educational development. Findings relating to the reading ability of this group of children compared with the total sample are discussed in Section VIC of this Report.
(b) Number of Children in the Household
The relationship between family size and measures of ability and attainment has been shown in a number of studies. Douglas (1964), for example, found that children of families of four or more in each of the socio-economic groups he examined were at a disadvantage educationally when compared with their peers in smaller families; the differences were most marked for children of manual workers. Of course, there are large families at all economic levels; however, there are proportionately more among unskilled workers, so that being a member of a large family may sometimes be another factor in an interacting set of unfavourable circumstances which have an adverse effect on a child's development.
Family size can be defined in various ways. The number of children in the 'normal' family will usually be the same under any meaningful definition, but for some family situations different definitions will affect the number of children to be included. Thus, different indices may be relevant in considering different aspects of children's development.
Here it was considered that, as an index of the social climate of the child's home life, the total number of children in the household under the age of 21 would be most meaningful. All children under 21 years belonging to one household were included, irrespective of whether or not they were related to the sample child (e.g. foster children, cousins, etc.). Also included were those living at home only during school holidays or for other short periods. The results presented in Table 41 show the distribution of children by the size of household.
[page 479]
Table 41
Number of Children in Household Under the Age of 21 Years
(including sample child)
| N | Per cent |
| One | 665 | 9.2 |
| Two | 2,629 | 36.2 |
| Three | 1,879 | 25.9 |
| Four | 1,068 | 14.7 |
| Five | 498 | 6.9 |
| Six or more | 519 | 7.1 |
| TOTAL INFORMATION | 7,258 | 100 |
In this sample of seven year olds, nine per cent were only children and seven per cent came from households of six or more. Since the sample was of children and not of households, the figures cannot, of course, be taken as an estimate of the distribution in the general population of numbers of children in households.
It is hoped at a later stage to compare these figures with other classifications of family size which can be obtained from the data.
4. Overcrowding
In accordance with the definition of maximum occupation density used by the 1961 census, the children in the sample were considered to be living in overcrowded homes whenever there were more than 1½ persons to a room. By this criterion, a family of three living in two rooms is not considered overcrowded, whereas a family of four people or more in the same accommodation is judged to be so. This official definition employs quite a severe standard (HMSO, 1965) and one that many people - even in average income sections of the community - would not regard as acceptable.
Data are available from the questionnaires on other main indices of poor housing conditions, such as multiple occupation and lack of basic domestic facilities. However, as this information could not be included at this stage, the present results cover only one aspect of unsatisfactory housing.
Table 42
Proportion of Children Living in Overcrowded Conditions
| N | Per cent |
| Not overcrowded | 6,391 | 88.8 |
| Overcrowded | 805 | 11.2 |
| TOTAL INFORMATION | 7,196 | 100 |
It can be seen from Table 42 that 11.2 per cent of this sub-sample were living in overcrowded conditions, as defined above.
[page 480]
It has been suggested that there is an association between various aspects of children's development and housing conditions (Douglas, 1964; Fraser, 1959), with poor housing being adversely related to children's general progress and school performance. This association, however, is an extremely complex one. Other factors must be taken into consideration, even when family difficulties appear at first to be primarily related to unsatisfactory housing.
Conditions of housing vary, of course, in different regions and neighbourhoods, with respect to factors such as age, size and state of repair, as well as sheer availability. Poor accommodation in a slum area may be differently associated with a child's progress than overcrowded accommodation in a better neighbourhood; similarly, much will depend on whether overcrowding is a temporary or permanent situation. The size and composition of the household, as well as the ages of its members, are further important considerations, and the personalities of the parents - particularly the mother - can greatly lessen or increase the strain of bad housing. Studies of problems associated with the establishment of new housing estates have shown the relevance of some of these factors, together with the pitfalls of making generalisations based solely or mainly on housing conditions (Taylor and Chave, 1964).
5. Mobility
(a) Moving Home
Data on this question were obtained from mothers of children who had lived with their parents since birth. The moves reported could be of any distance. Table 43 shows how often the family had moved since the child in our sample was born.
Table 43
Number of Times Family has Moved Since Child's Birth
| Number of moves | N | Per cent |
| None | 2,866 | 36.4 |
| One | 2,892 | 36.7 |
| Two | 1,064 | 13.5 |
| Three | 512 | 6.5 |
| Four | 262 | 3.3 |
| Five | 102 | 1.3 |
| Six | 82 | 1.0 |
| More than six | 103 | 1.3 |
| Total information | 7,883 | 100 |
| No data | 102 | |
| TOTAL | 7,985 | |
About a third of the children have not moved at all in comparison with 64 per cent who have moved once or more. Thirteen per cent have moved twice and 13 per cent of the children have done so three or more times. These totals may well be an underestimate of the amount of moving in the total cohort, since the untraced children who are not, of course, included, are more likely to belong to families who move frequently.
[page 481]
Not a great deal is known about the effects of frequent moves on the growth and development of young children. Available data will make it possible to analyse at a later stage some of the factors that may be related to what seems to be a not uncommon experience for about a quarter of the present sample.
(b) Changing School
The number of schools which the mothers reported the child to have attended since the age of five is shown in Table 44.
Table 44
Number of Schools Attended Since the Age of Five
| N | Per cent |
| One | 6,424 | 82.1 |
| Two | 1,209 | 15.4 |
| Three | 165 | 2.1 |
| Four | 20 | 0.3 |
| Five and over | 7 | 0.1 |
| Total information | 7,825 | 100 |
| No data | 160 | |
| TOTAL | 7,985 | |
By the time the children were at the end of their infant schooling, 15.4 per cent had changed school once and 2.5 per cent two or more times. This presents a somewhat different picture from the previous table and may indicate that more frequent moves of home take place before the child goes to school, or that the moves are in the same locality so that no school change is involved.
Reasons for changes of school vary, as will the effect of the changes on children's educational progress. School factors, as well as those in the child's personality and home background, may play an important part. Further analysis of different factors in this group of children's development and home background will be possible at a future stage in relation to the possible influence of changing school and moving house.
6. School Attendance
Information was gathered from the schools about the children's attendance from the beginning of the Autumn Term 1964 to the Summer Term 1965, the latter being the time when the educational questionnaires were completed for the majority of the children. Teachers were also asked to give a rating of children's attendance on the Bristol Social Adjustment Guide but, at present, only the objective data are presented.
In the present sample 70 per cent of the children were recorded as having an attendance rate of 90 per cent or higher. This is equivalent approximately to 18 days' absence, or less, in a school year. About nine per cent of children had an attendance record of below 80 per cent. Children who have been admitted to a particular school only recently and thus attended for a short period are included; the results for these children will obviously be less reliable. It was noted in checking the completed material that this particular
[page 482]
question was not well answered due, perhaps, in some measure to the way in which it was asked. Although it was felt that this was unlikely to have affected the overall results seriously, these should be regarded as tentative in view of this proviso.
Table 45
Percentage Attendances
Percentage of
possible attendances | N | Per cent |
| 95-100 | 4,854 | 45.7 |
| 90-94 | 2,505 | 23.6 |
| 85-89 | 1,517 | 14.3 |
| 80-84 | 804 | 7.6 |
| 75-79 | 428 | 4.0 |
| 70-74 | 202 | 1.9 |
| Under 70 | 319 | 3.0 |
| Total information | 10,629 | 100 |
| No data | 16 | |
| GRAND TOTAL | 10,645 | |
Many circumstances in the children's home background may influence their records of attendance. Health is an important aspect and is, itself, associated with other factors in the home background, such as standards of parental care and parents' interest in their children's education. On the other hand, the influence of the school is also very important. It seems likely that just as poor school attendance may adversely affect children's progress in school, so poor progress and adjustment in school may in some cases lead to poor attendance.
Further, there is some evidence (Douglas and Ross, 1965) that schools differ in the extent to which they succeed in helping children whose educational progress has been adversely affected by absence.
7. Parental Interest
There is considerable evidence from research that parents' attitudes to and interest in their children's education are closely associated with school performance (Fraser, 1959; Douglas, 1964; Wiseman, 1964). These attitudes and interest are themselves often associated with a number of other factors of general care which are related to children's development. For example, a mother realistically concerned with her child's education is also more likely to take advantage of other available services for his welfare. However, in this section the discussion is confined to the interest that parents show in their children's educational progress.
Two assessments were made of parental interest. The first was a subjective assessment by the teachers who were asked to rate the mother's and father's interest with regard to their child's educational progress. This had the limitations of any subjective estimate. On the other hand, the teacher could take into account a number of factual indications of parental interest besides personal contact, such as the children's comments and parents' attendances at school meetings.
[page 483]
The second assessment was of a more objective nature. Head teachers were asked if, since September 1964, the parents had taken the initiative to discuss the child, even briefly, with any member of the teaching staff. Despite the advantage of greater objectivity, this question also had its limitation because certain parents, however much they were interested in their child's educational progress, might have been unable to visit the school. The results for the subjective assessment of the teachers are presented in Tables 46 and 47.
Table 46
Teachers' Ratings of Maternal Interest
| Maternal interest |
| Boys | % | Girls | % | Total | % |
| Over-concerned | 179 | 3.2 | 132 | 2.5 | 311 | 2.9 |
| Very interested | 1,811 | 32.7 | 1,989 | 37.6 | 3,800 | 35.1 |
| Shows some interest | 2,283 | 41.2 | 2,077 | 39.2 | 4,360 | 40.3 |
| Shows little or no interest | 901 | 16.3 | 743 | 14.0 | 1,644 | 15.2 |
| Can't say or inapplicable | 360 | 6.5 | 354 | 6.7 | 714 | 6.6 |
| Total information | 5,534 | 100 | 5,295 | 100 | 10,829 | 100 |
| No data | 2 | | 2 | | 4 | |
| TOTAL | 5,536 | | 5,297 | | 10,833 | |
Chi-squared (Trend) = 15.8; p < 0.001
Table 47
Teachers' Ratings of Paternal Interest
| Paternal interest |
| Boys | % | Girls | % | Total | % |
| Over-concerned | 83 | 1.5 | 59 | 1.1 | 142 | 1.3 |
| Very interested | 1,269 | 23.0 | 1,283 | 24.3 | 2,552 | 23.6 |
| Shows some interest | 1,259 | 22.8 | 1,117 | 21.1 | 2,376 | 22.0 |
| Shows little or no interest | 960 | 17.4 | 793 | 15.0 | 1,753 | 16.2 |
| Can't say or inapplicable | 1,949 | 35.3 | 2,036 | 38.5 | 3,985 | 36.9 |
| Total information | 5,520 | 100 | 5,288 | 100 | 10,808 | 100 |
| No data | 16 | | 9 | | 25 | |
| TOTAL | 5,536 | | 5,297 | | 10,833 | |
Chi-squared (Trend) = 7.2; 0.01 > p > 0.001
The difference between the assessments of the mothers' reported interest and the fathers' in the 'can't say' category would be expected as so many fathers cannot - even if they wish - visit their children's school during the day because of working hours. Even so, teachers felt able to comment on the interest of 63 per cent of the children's fathers. Approximately 75 per cent of the mothers and 46 per cent of the fathers were rated as showing some interest or being very interested in their child's educational progress.
[page 484]
It is worth noting that the proportion of mothers (15.2 per cent) and of fathers (16.2 per cent) reported as showing little or no interest was almost the same. This seems to indicate that teachers were able to give an equally definite rating for each parent in this category despite fathers' greater difficulty in making daytime visits.
The teachers' ratings show a significantly different tendency for parents to take a greater interest in the girls' educational progress than in the boys'. This is rather unexpected, as it contrasts with parental attitudes towards the education of older children; then the reverse is the case, with boys' scholastic progress being considered of much greater importance and greater numbers of boys staying on at school beyond the compulsory school leaving age.
Although such trends as do appear tend to favour the girls, the difference in the parents' interest shows rather a complex pattern with no clear-cut results. It is also possible that this finding is due to some bias in the teachers' ratings. Since girls' school performance is better than boys', the teachers' ratings of parental interest may be influenced by a knowledge of the child's performance; i.e. if a child is doing well at school, the teachers may make an assumption of parents' interest in the child's educational progress.
With regard to the second more objective criterion used to assess parental interest, it can be seen (Table 48) that during the current school year 57 per cent of parents took the initiative to discuss their children with one of the teaching staff.
Table 48
Parental Approach to School Staff
| Boys | Girls | Total |
| N | Per cent | N | Per cent | N | Per cent |
| Have approached school staff | 3,183 | 57.5 | 2,972 | 56.1 | 6,155 | 56.9 |
| Haven't approached school staff | 2,348 | 42.4 | 2,321 | 43.8 | 4,669 | 43.1 |
| Total information | 5,531 | 100 | 5,293 | 100 | 10,824 | 100 |
| No data | 5 | | 4 | | 9 | |
| TOTAL | 5,536 | | 5,297 | | 10,833 | |
Chi-squared = 1.2 (1 d.f.); p > 0.05 not significant
It would be expected that contact between staff and parents would be easier at the infant school stage, when it is more likely that parents will accompany their children to and from school and the general atmosphere is more informal. Even so, it seems that 43 per cent of the parents of this sample had not initiated any contact with school staff during the period in question.
It can be considered that parental interest in their children's education will to some extent be a reflection of the school's own attitudes and interest in the children's families. A further question was asked to find out more about the amount of personal contact between staff and parents, initiated by the
[page 485]
staff. Head teachers were asked if there had been any discussion with the parents about the child 'at the instigation of you or your teaching staff'. The replies to this question are shown in Table 78.
Table 49
School Instigation of Discussion
| Boys | Girls | Total |
| N | Per cent | N | Per cent | N | Per cent |
| School has instigated discussion with parents | 1,531 | 27.7 | 1,231 | 23.2 | 2,762 | 25.5 |
| School has not instigated discussion with parents | 3,996 | 72.3 | 4,065 | 76.8 | 8,061 | 74.5 |
| Total information | 5,527 | 100 | 5,296 | 100 | 10,823 | 100 |
| No data | 9 | | 1 | | 10 | |
| TOTAL | 5,536 | | 5,297 | | 10,833 | |
Chi-squared = 28.3 (1 d.f.); p < 0.001
The staff had instigated discussion with 25.5 per cent of the children's parents. There is a difference of four per cent in the proportion of boys and girls discussed. This difference was highly significant statistically. It may, in part at least, be due to the fact that boys in the sample made less satisfactory progress in reading and were less well-adjusted in school (see Section V6). Hence, teachers would feel greater concern about their progress and thus be more anxious to talk to parents about it.
There will be some parents who, as well as having initiated a discussion themselves, will also have discussed their child at the teacher's instigation. After allowance had been made for the overlap between these two groups, a final total was estimated of the number of children whose parents and teachers were reported as having had some discussion about them. This total amounted to 65 per cent of the children in this sample; thus, from September to near the end of the school year, about two thirds of the seven year olds in the Study had been jointly considered by their teachers and parents. Further analysis of parents' interest in their children's educational progress and its relationship to other factors will be made at a later stage. However, an analysis of reading ability and parental interest is made in Section VIC.
8. Parental Aspiration
As an indication of a more general attitude to education, mothers were asked if they would like their child to be able to stay on at secondary school after the minimum school leaving age.
[page 486]
Table 50
Parents Wanting Children to Stay on at Secondary School After Minimum School Leaving Age
| Boys | Girls | Total |
| N | Per cent | N | Per cent | N | Per cent |
| Yes | 3,345 | 82.4 | 3,132 | 79.8 | 6,477 | 81.2 |
| No | 176 | 4.3 | 169 | 4.3 | 345 | 4.3 |
| Other | 154 | 3.8 | 174 | 4.4 | 328 | 4.1 |
| Don't know | 382 | 9.4 | 449 | 11.4 | 831 | 10.4 |
| Total information | 4,057 | 100 | 3,924 | 100 | 7,981 | 100 |
| No data | 2 | | 2 | | 4 | |
| GRAND TOTAL | | | | | 7,985 | |
Chi-squared = 11.6 (3 d.f.); 0.01 > p >0.001
The statistical evidence shows that there is a difference between the answers given by parents of boys and by parents of girls. More parents of the boys than of the girls wanted them to stay on at school after the minimum school leaving age. It will be noted that of the criteria of parental interest so far examined, this is the only indication of more interest being taken in boys' education than in girls'.
This question was answered in the affirmative by 81 per cent of the mothers. Of the remainder, only four per cent gave an unqualified 'No'.
Of course, at this early age when the actual decision is many years ahead and less realistic, a socially more acceptable answer is likely to be given. Very probably, parental attitudes will undergo changes during the years until this question confronts them as an immediate issue. Nevertheless, the present result would seem to indicate a favourable climate of opinion towards continued secondary education beyond the statutory leaving age.
9. Summary
(a) Most of the data in this section were obtained from 7,985 completed Parental Questionnaires. The statistically significant but not marked bias in this sub-sample suggests that findings relating to adverse conditions are likely to underestimate the incidence of such circumstances in the total cohort.
(b) The present occupations of the children's fathers were grouped according to the Registrar General's five Social Class divisions, and the distribution was compared with those of the 'late returns' and of a national sample. The Social Class divisions formed the basis of a regrouping of the fathers' occupation into the five occupational groups which are used for the main socio-economic classifications in this Report.
(c) Approximately six per cent of the children were not living with both of their natural parents.
(d) Approximately nine per cent were living in households in which they were the only child, 77 per cent in households of two, three or four children, and 14 per cent in households where there were five or more children.
[page 487]
(e) Approximately 11 per cent of the children were living in 'overcrowded' conditions.
(f) About two thirds of the children had moved home once or more since they were born. Approximately 13 per cent had moved twice and a further 13 per cent three or more times.
(g) Since the age of five, 15.4 per cent of the children had changed school once and 2.5 per cent two or more times.
(h) Of 10,645 children for whom this information was available, 70 per cent were recorded as having an attendance rate of 90 per cent or higher. About nine per cent of the sample had a record of below 80 per cent attendance.
(i) Some 57 per cent of parents had approached a member of the school staff in the current academic year in order to discuss their children. There was no significant difference between the parents of boys and girls in this respect. Teachers' ratings of parental interest on the other hand seemed to show that the girls' parents were more interested in their children's educational progress than the boys'. However, it is possible that the teachers' ratings may have been influenced to an extent by the better progress of the girls. Of the 26 per cent of children whose teachers had instigated discussion with parents, there were significantly more boys than girls.
(j) About 81 per cent of the parents said they would like their children to stay on at school after the minimum school leaving age.
References
DOUGLAS JWB The Home and the School (McGibbon and Kee) (1964).
DOUGLAS JWB and Ross JM 'The Effects of Absence on Primary School Performance'. Brit. J. Educ. Psychol. 35, pp. 28-40 (1965).
FLOUD JE, HALSEY AH and MARTIN FM Social Class and Educational Opportunity (London: Heinemann) (1957).
FRASER ED Home Environment and the School (University of London Press) (1959).
GENERAL REGISTER OFFICE Classification of Occupations (HMSO) (1960).
GENERAL REGISTER OFFICE Census 1961: Occupation Tables, England and Wales (HMSO) (1966).
LEWIS H Deprived Children, the Mersham Experiment (Oxford University Press) (1954).
MINISTRY OF HOUSING AND LOCAL GOVERNMENT Report of the Committee on Housing in Greater London (HMSO) (1965).
PRINGLE ML KELLMER Deprivation and Education (Longmans) (1965).
ROE MC Survey into Progress of Maladjusted Pupils (ILEA) (1965).
TAYLOR Lord, and CHAVE S Mental Health and Environment (Longmans) (1964).
WISEMAN S Education and Environment (Manchester University Press) (1964).
WYNN M Fatherless Families (Michael Joseph) (1964).
F. BEHAVIOUR AND ADJUSTMENT
1. Introduction
This section is concerned with aspects of the children's behaviour and adjustment in school and home as reported by their teachers and mothers. Here,
[page 488]
as in other sections of this interim report, the total number of children included in different tables varies. The reasons for this have already been explained.
The evidence (see Section IIB: 'Description of the Sample') that the children for whom Parental Questionnaires had been received in time for inclusion in the present Report were better adjusted in school than those for whom a Parental Questionnaire had not been received, is particularly relevant to any interpretation of results in this section. It is reasonable to assume that the former group would also be better adjusted at home. Thus, where results are presented here which are derived from mothers' reports of children's behaviour, the figures may underestimate to some extent the incidence in the total sample, when the behaviour in question is indicative of difficulties. However, there is no expectation that any such bias will affect comparisons between the sexes.
There is one other general factor which should be stressed. Although all figures presented in this Report should be seen in relation to the circumstances in which the information was collected and the way in which questions were put, it is particularly important to have this in mind when assessing the validity of data about behaviour and adjustment. An attempt has been made to reduce reporting error or bias by gathering, wherever possible, current rather than retrospective data. Nevertheless, in many questions what is being assessed is essentially a facet of a relationship between two people (a mother and a child, a teacher and a child) rather than simply an objective fact about a child. In the case of the mothers' reports of the children's behaviour, these were given to a third person, usually a health visitor.
This factor does not invalidate the results, but it does mean, particularly when statistics are seen as incidences, that the total framework must be borne in mind. Thus, for the sake of convenience and brevity, a sub-section is here entitled 'Children's Happiness at School'; in essence, however, the figures tell what the mothers reported about their children's happiness at school when posed a particular question on one occasion by a health visitor. It is possible that if the enquiry had been carried out by post, if the mothers had had time to consult their husbands, or if the question had been put by or to teachers, by psychologists or by a trained team of interviewers, then the results obtained may have been somewhat different. On the other hand, it would be foolish to disregard the results on this account unless there was evidence that a question on this topic, and posed under these circumstances, produced a very distorted picture. No method of enquiry is faultless, but each has limitations. Where there is possibility of distortion or bias, the implications are considered.
Information was obtained about the children's behaviour and adjustment in order, first, to test certain hypotheses about general adjustment, as well as particular facets of it, in relation to other factors; to examine, if comparable information can be collected on these children as they mature, the ways in which patterns of behaviour shown at seven years of age change or remain constant at later ages; to provide some data on the behaviour of a representative group of seven year olds; and to compare the sexes at this age. Although the last point is here mentioned separately, it should, strictly, be included with the first since a relationship is examined between two variables, namely behaviour and the sex of the children.
[page 489]
In the present section only the last two points are covered: descriptive data are given and the sexes are compared. Sub-section 2 deals with the children's behaviour and adjustment as assessed by their teachers; and in sub-section 3 results are presented for different aspects of behaviour as reported by mothers.
2. Behaviour and Adjustment - Teachers' Assessments
(a) Settling Down Period on Starting School
The head teachers were asked whether on starting school the children settled down within a month; within 1-3 months: or remained unsettled after three months. Since the children's present schools will not always have been their first ones, the results do not relate to the settling down period on first starting school; nevertheless, over 82 per cent of the children had been to one school only (see Section VF: 'Environmental Factors').
There will be some loss of reliability due to the fact that the data are retrospective by some two years in the majority of cases. There is also the possibility of some distortion of the results for individual children. Thus, if a child is now quite 'normal' and well-adjusted, there is perhaps less likelihood of an unsettled period two years ago being remembered.
The results are presented in Table 80 and relate to children in 'ordinary' maintained and independent schools. The large number of children listed as 'Can't say' is most likely to be a reflection of the difficulty of obtaining retrospective information from schools because of staff changes. It will be seen that the figures for these children have not been percentaged, since there is no reason to believe that if the information had been available, they would not have been distributed proportionately in the other categories. Where a child had been at a school less than three months, the full range of possible answers was not open to the head teachers. These children were therefore coded as 'Inapplicable'.
It will be seen that, as judged by this criterion, the great majority of the children (94 per cent) had settled down on starting at a first or a new school within three months.
The difference between the sexes was highly significant statistically. The trend, furthermore, persisted through the three categories. The girls were reported to have settled down in school more quickly than the boys.
Table 51
Settling Down Period on Starting School
| Settling down period | Boys | Girls | Total |
| N | Per cent | N | Per cent | N | Per cent |
| Within 1 month | 3,783 | 74.3 | 3,883 | 78.6 | 7,666 | 76.4 |
| 1-3 months | 949 | 18.6 | 817 | 16.5 | 1,766 | 17.6 |
| Unsettled after 3 months | 358 | 7.0 | 241 | 4.9 | 599 | 6.0 |
| Total assessed | 5,090 | 100 | 4,941 | 100 | 10,031 | 100 |
| Can't say | 348 | | 287 | | 635 | |
| Inapplicable | 86 | | 64 | | 150 | |
| No data | 12 | | 5 | | 17 | |
| GRAND TOTAL | 5,536 | | 5,297 | | 10,833 | |
Chi-squared (Trend) = 31.6; p < 0.01
Chi-squared (Departure) = 0.3 (1 d.f.); p > 0.05 not significant
[page 490]
The possibility of some distortion of the results for individual children has already been discussed. It was suggested that a child's present behaviour may influence a teacher's memory of a facet of his behaviour two years before. It may be that such retrospective distortion is partly or wholly responsible for the present findings. Thus, there is evidence that the boys in the sample were less well-adjusted in school (see sub-section 2(b) of the present section). The difference between the sexes demonstrated above may, then, reflect their present behaviour.
However, the fact that the same difference between the sexes is evident when the mothers' reports of the children's settling down period on first starting school are examined (see sub-section 3(b)) makes it less likely that the present findings are spurious. Nevertheless, the possibility cannot be ruled out that the same factors were operating in the mothers' retrospective reporting.
Under the circumstances, the evidence of a sex difference here must be regarded as tentative at the present stage. Further research is needed to confirm the results.
(b) Bristol Social-Adjustment Guide Scores
The difficulties of obtaining a reliable and valid measure of adjustment are very considerable; much less progress has been made by psychologists in this field than, for example, in measuring intellectual abilities and attainments. Furthermore, in a study of this magnitude of seven year olds, one is confined to an assessment of the children's adjustment by some other person. As has been mentioned earlier, one is essentially obtaining a measure of a relationship between two persons; in this case a child and his teacher. This is not irrelevant since social adjustment cannot be viewed in isolation, but in individual cases there will be differences between a child's adjustment as seen by different teachers.
Such differences, however, are less likely to be marked if, instead of obtaining global assessments, one asks specific questions about particular aspects of behaviour. The Bristol Social-Adjustment Guide (Stott, 1963) in effect does this. The Guide consists of a large number of descriptions of behaviour and the teacher is asked to underline those descriptions which best fit the child. Aspects of behaviour which appear to be deviant are specially coded and it is therefore possible, by summing these items for an individual child, to obtain a quantitative assessment of social adjustment in school; the higher the score, the more manifestations of deviant behaviour have been noted by the teacher. It is obvious that a child's behaviour can be deviant in many ways. Thus, he may be unforthcoming, aggressive or over-demanding. A total score masks all these different facets and therefore its use is only warranted as a relatively crude assessment which may be useful in certain kinds of analyses or as a first step before a more detailed and sophisticated analysis.
At the present stage in this Study, there has been time only to examine total scores. For convenience, and as a first step, it has been decided to classify the children as proposed by Stott: children with a score from 0 to 9 are grouped and called 'stable'; those with a score from 10 to 19 are called 'unsettled'; and the children with a score of 20 or more are called 'maladjusted'. The groups are therefore operationally defined in these terms. Thus, no assumption is made that children with a score of 20 or more are maladjusted in any sense other than that defined above.
[page 491]
The results are presented in Tables 52 and 53. A word of explanation is needed about these figures. In both tables, the numbers involved are several hundred less than the number of Guide scores available. This reduction is due to technical difficulties arising from the data processing; there is no reason to believe that the children excluded are different from the ones included in any specific way.
In Table 52 the figures for children in all categories of school have been extracted from a more detailed table not presented in this Report, in which there was a breakdown by occupational group and Sex. Where there were no data on either the sex of the child (very few) or the occupation of the father, the children were excluded. This sub-sample is known to be biased in that they are better adjusted in school than those where the occupational group was not known (see Introduction to present section). Although this bias is not expected to affect a comparison of the sexes, the combined figures would be biased. However, the figures given in Table 53 include all the children in schools (including special schools) in the present sample for whom a score was available, and there is no evidence of bias in this group.
Table 52
Bristol Social-Adjustment Guide Scores - Boys and Girls
| Scores | Boys | Girls |
| N | Per cent | N | Per cent |
| 'Stable' (Score 0-9) | 1,929 | 59.5 | 2,376 | 73.7 |
| 'Unsettled' (Score 10-19) | 808 | 24.9 | 587 | 18.2 |
| 'Maladjusted' (Score 20+) | 507 | 15.6 | 260 | 8.1 |
| TOTAL ASSESSED | 3,244 | 100 | 3,223 | 100 |
Chi-squared (Trend) = 158.7; p < 0.001
Chi-squared (Departure) = 2.2 (1 d.f.); p >0.05 not significant
Table 53
Bristol Social-Adjustment Guide Scores - Combined Sexes
| Scores | N | Per cent |
| 'Stable' (Score 0-9) | 6,280 | 64.0 |
| 'Unsettled' (Score 10-19) | 2,223 | 22.6 |
| 'Maladjusted' (Score 20+) | 1,314 | 13.4 |
| TOTAL ASSESSED | 9,817 | 100 |
[page 492]
The comparison between the sexes in Table 52 shows a highly significant difference; the girls were better adjusted in school. Approximately 60 per cent of the boys were 'stable' as against 74 per cent of the girls; on the other hand, nearly 16 per cent of the boys were 'maladjusted' compared with eight per cent of the girls. The results, strictly interpreted, apply only to this form of assessment. Nevertheless, in view of the very marked differences shown, the firm conclusion is warranted that at this age boys show more indications of poor adjustment in school than girls.
These results confirm those found by Crawford (1966), who used the Guides in a Liverpool study on 773 boys and girls aged seven and eight years.
Two points should be borne in mind. First, the results derived from total scores may mask other factors. Thus, despite an overall difference between the sexes, it may be that detailed examination of the data will show no differences between the sexes in particular facets of adjustment; or, even, that girls show more deviant behaviour in some ways. For example, boys may be more aggressive or over-demanding and girls may be more timid or withdrawn. This further detailed study of the data will be undertaken later. Secondly, since this sub-sample is known to be biased in relation to adjustment in school, the percentages shown in Table 52 should not be taken as representative figures for the sexes.
In Table 53 the results are presented for a larger sample of children, since no other results are available for this test on a national sample of this size. There is no expectation of bias in these results.
It was stressed earlier that the definitions of 'stable', 'unsettled' and 'maladjusted' are operational ones and refer only to scores on the Guides. The grouping used by Stott and others has been adopted as a first step and to permit comparison with other studies. To say, therefore, that the present findings indicate that over 13 per cent of seven year olds are maladjusted is to say no more than that over 13 per cent of seven year olds are likely to obtain a total score of 20 or more on the Social-Adjustment Guides.
It would be taking too extreme a view to say that the term 'maladjusted' means all things to all men. Nevertheless, the difficulties of establishing some reliable criterion of maladjustment against which to validate an objective score such as is derived from the Guide are considerable.
From a practical viewpoint there is an obvious need to establish the proportion of school children who would benefit from some form of psychological help or from psychiatric treatment. The need for such information was underlined by the Underwood Committee (HMSO, 1955) and the Scottish Education Department (HMSO, 1964). It is hoped at a later stage to throw some light on this matter with the data available on this cohort of children; and also to examine in some detail the factors which are associated with maladjustment.
3. Behaviour and Adjustment - Mothers' Reports
(a) Happiness at School
The mothers were asked: 'Is the child happy at his/her present school?' The answers were pre-coded by the interviewers into the categories shown in Table 54. The results are for children in all types of school.
[page 493]
Table 54
Happiness at School
| Boys | Girls | Total |
| N | Per cent | N | Per cent | N | Per cent |
| Happy | 3,708 | 92.1 | 3,694 | 94.5 | 7,402 | 93.2 |
| Not altogether happy | 302 | 7.5 | 205 | 5.2 | 507 | 6.4 |
| Unhappy | 18 | 0.4 | 12 | 0.3 | 30 | 0.4 |
| Total information | 4,028 | 100 | 3,911 | 100 | 7,939 | 100 |
| Don't know | 30 | | 15 | | 45 | |
| No data | - | | 1 | | 1 | |
| GRAND TOTAL | 4,058 | | 3,927 | | 7,985 | |
Chi-squared (Trend) = 17.3; p < 0.001
Chi-squared (Departure) = 0.8; (1 d.f.); p > 0.05 not significant
The difference between the sexes is highly significant. A strict interpretation of the results would be that girls at this age are reported by their mothers to be happier at school than boys. However, there is some indirect evidence from the present Study to indicate that this may be interpreted as a meaningful difference between the sexes in the extent to which they are in fact happy at school. Thus, the independent assessments of the teachers showed that girls are markedly better adjusted at school, and it is reasonable to assume that this would be reflected in their 'happiness'.
Nevertheless, the subjectivity of this question imposes a need for caution, particularly in viewing the percentage figures in the three categories. One must consider the possibility that the mothers may have seen their answers as a reflection upon the school, although there is no reason to believe that any such tendency would have acted in one direction only. Further, it had to be left to the interviewer to make a reasoned judgement about which category to code in the light of the mother's answer.
However, within the limitations of this type of question, the overall results are extremely encouraging from an educational standpoint and do credit to the teachers and schools concerned.
(b) Settling Down Period on First Starting School
Information about the length of the settling down period on first starting school was obtained from the mothers. The same question was also put to the head teachers (see sub-section 2(a) of the present section), although their replies would relate to the children's settling down in their present school, which would not necessarily have been their first one.
Some of the children attended a private or a local authority nursery class or school, and the results for these are presented in Table 55; and relate to the settling down period on commencing nursery schooling. In Table 56 the results are given for children who did not attend a nursery class or school. Although these results were obtained by sorting punched cards, it was possible to include a few (52) additional children so that the total for Tables 55 and 56 are slightly higher than for tables in the remainder of this section. The children involved were in all categories of school.
[page 494]
Table 55
Settling Down Period on First Starting School
(Nursery Class/Nursery School Attenders)
| Boys | Girls | Total |
| N | Per cent | N | Per cent | N | Per cent |
| Within a month | 506 | 83.0 | 502 | 88.7 | 1,008 | 85.7 |
| Within 1-3 months | 56 | 9.2 | 39 | 6.9 | 95 | 8.1 |
| Still unsettled after 3 months | 48 | 7.9 | 25 | 4.4 | 73 | 6.2 |
| Total information | 610 | 100 | 566 | 100 | 1,176 | 100 |
| Don't know | 2 | | 5 | | 7 | |
| GRAND TOTAL | 612 | | 571 | | 1,183 | |
Chi-squared (Trend) = 8.6; 0.01 > p > 0.001
Chi-squared (Departure) = 0.03 (1 d.f.); p > 0.05 not significant
Table 56
Settling Down Period on First Starting School
(Non-Nursery Class/Nursery School Attenders)
| Boys | Girls | Total |
| N | Per cent | N | Per cent | N | Per cent |
| Within a month | 2,804 | 82.1 | 2,814 | 84.4 | 5,618 | 83.2 |
| Within 1-3 months | 322 | 9.4 | 293 | 8.8 | 615 | 9.1 |
| Still unsettled after 3 months | 289 | 8.5 | 228 | 6.8 | 517 | 7.7 |
| Total information | 3,415 | 100 | 3,357 | 100 | 6,802 | 100 |
| Don't know | 29 | | 21 | | 50 | |
| No data | 1 | | 1 | | 2 | |
| GRAND TOTAL | 3,475 | | 3,379 | | 6,854 | |
Chi-squared (Trend) = 7.6; 0.01 > p > 0.001
Chi-squared (Departure) = 0.1 (1 d.f.); p > 0.05 not significant
It has not been possible at the present time to examine statistically any differences between the settling down period for those who attended a nursery class or school and those who did not. Inspection of the tables suggests no very marked overall differences, but a straightforward comparison of these tables is likely to be misleading; a more sophisticated analysis is needed which takes into account other factors which may be associated with nursery school attendance.
In both tables, however, the results indicate that girls are considered by their mothers to settle down more quickly than boys on first starting school. Although confirming the results obtained in a comparison of the sexes on the teachers' assessments (see sub-section 2(a) of this section), the same reservations expressed there apply to the above results.
The overall figures are not strictly comparable with the teachers' assessments given in Table 51, both because of the bias in the present sub-sample and also
[page 495]
because the teachers were not necessarily assessing the children's settling down period on first starting school. Furthermore, any differences between Tables 51 and 56 may be due to the fact that mothers and teachers see the situation from different standpoints.
(c) Developmental Difficulties
It was decided to seek information from mothers about developmental difficulties which occurred largely in the home. Three steps were taken to increase the reliability of the data. First, mothers were asked to say whether any of the difficulties had occurred over a prescribed period; namely, 'during the last three months'. Secondly, specific aspects of behaviour were selected so that it was reasonable to ask for a straightforward 'Yes' or 'No', although a 'Don't know' reply was included in the coding. Thirdly, if the behaviour had occurred only during a period of acute infection, the interviewers were asked to code the answer as 'Inapplicable'.
The results are presented in Table 57 and relate to all children in the present sample for whom information was available, whether they were in school or not. Percentage figures only are given here and they refer to children whose mothers reported that the behaviour in question occurred during the three months prior to the interview. The small numbers of children where 'Don't know' or 'Inapplicable' was coded have been excluded from the percentaging. Although the results are presented in one table, the categories are, of course, not mutually exclusive and a child may appear under more than one category.
Table 57
Developmental Difficulties Occurring Over a Three-Month Period (percentaged)Number of boys = 4,058; Number of girls = 3,927; Total = 7,985
Developmental
difficulties | Boys
% | Girls
% | Total
% | Chi-
squared
(2 d.f.) | P value |
| Has complained of headaches (more than once) | 20.3 | 20.9 | 20.6 | 0.4 | > 0.05* |
| Has had temper tantrum | 29.8 | 27.1 | 28.5 | 7.1 | 0.01 > p > 0.001 |
| Has been reluctant to go to school | 12.2 | 9.6 | 11.0 | 13.9 | < 0.001 |
| Has had bad dreams or night terrors | 17.2 | 16.1 | 16.6 | 1.6 | > 0.05* |
| Has had difficulty in getting off to sleep | 18.1 | 20.2 | 19.1 | 5.8 | 0.05 > p >0.01* |
| Has sleepwalked | 3.1 | 3.4 | 3.2 | 0.8 | > 0.05* |
| Has been faddy - many dislikes over food | 27.8 | 30.4 | 29.1 | 6.2 | 0.05 > p > 0.01* |
| Has had poor appetite | 15.4 | 17.7 | 16.5 | 7.5 | 0.01 > p > 0.001 |
| Has over-eaten for more than the occasional meal | 7.1 | 6.0 | 6.5 | 3.7 | > 0.05* |
*Not significant
In examining the table, one must take account of two main factors. First, the bias in this sub-sample, discussed in the introduction to this section, may mean that some of the figures quoted underestimate the incidence in the total population of seven year olds in the country. Nevertheless, it would be unwise to over-stress the effect or the importance of this bias in considering the value of the results. Its effect is unlikely to be marked and it should be
[page 496]
viewed within the framework of the limitations inevitably imposed upon data of this kind collected in a large survey. One is dependent upon the mothers' reports, which may be influenced by such factors as their own personalities, education, tolerance level and the attitude of the interviewer; further, the behaviour was reported to have occurred over a particular period of time which, if changed, may have produced somewhat different figures.
Thus, the results in relation to many other kinds of data are of a crude nature. The fact that figures are given to one decimal place must not be taken as implying that exact information is being obtained. On the other hand, no clinician, no teacher, no social worker would claim that information he obtained is without its own limitations. The value of data gathered on a large group of children is that it provides workers in this field with a frame of reference, a 'backcloth' against which to view the normality or deviance of behaviour manifested by an individual child, or a group of children, of this age. It will also permit the changing pattern of behaviour to be studied as the children grow towards maturity, if - as is hoped - further information can be gathered upon them. Neither the limitations discussed, nor the bias, are likely to affect the overall pattern of the results, the relative incidence of different difficulties. Thus, it will be seen that the reported occurrence of a temper tantrum or of faddiness is not uncommon; about 30 per cent of the children were reported to have shown these aspects of behaviour. Sleepwalking, on the other hand, is reported as occurring only in a small minority of children of this age.
The second main factor which must be borne in mind is that the figures apply to behaviour in the home as seen by mothers. For some aspects of behaviour, such as difficulties in sleeping, this is the only appropriate framework within which to view the data. However, other behaviour, such as food-faddiness or temper tantrums, manifests itself in other situations - in school, for example. It is highly likely that if information on these aspects of behaviour had been obtained from teachers, different results would have been obtained because children behave differently in different circumstances.
None of these aspects of behaviour in isolation should be seen as an indication of poor adjustment. Nevertheless, it is likely that some are more symptomatic of emotional disturbance than others. In addition, a number of workers have shown that a simple summation of reported behavioural difficulties for individual children provides some measure of adjustment which is associated with poor educational performance and other factors. It is intended to investigate this further at a later stage and to see which difficulties and which combination of difficulties are most closely related to other factors, both in the home and in the school.
With regard to a comparison between the sexes in the reported occurrence of the 'developmental difficulties' set out in Table 57, it will be seen that for only three items was there a significant difference. The 'P' values are given, and for reasons which are explained in Section IV: 'Statistical Analysis', the level of 0.01 has been selected as the one which in this Report is used as the criterion of statistical significance.
There is clear evidence from the present findings that, as reported by mothers, more boys than girls show reluctance to go to school; that more boys have temper tantrums at this age; and that more girls are considered to have poor appetites.
[page 497]
(d) Other Aspects of Children's Behaviour
In addition to the behaviour reported by mothers which has been discussed in the previous sub-section, the mothers were asked about other aspects of behaviour. Although in the Parental Questionnaire and in this Report the two groups of items are presented separately, there is no clear-cut distinction between them from a psychological viewpoint. The developmental difficulties already discussed were so described because this seemed an appropriate term. Nevertheless, some of the aspects of behaviour discussed in this section might equally well have been described as difficulties.
One major reason for separating these two groups of items in the questionnaire was that for some aspects of behaviour it seemed appropriate to ask for a straightforward answer as to whether or not the behaviour had occurred during a prescribed period; for the behaviour discussed here it seemed more appropriate to enquire whether 'at the present time' it happened 'frequently', 'sometimes' or 'never'.
The results are presented in Table 58 and relate to all children in the sample for whom the information was available, whether they were in school or not. The figures are given in percentage form and where an answer was coded 'Don't know' or 'Inapplicable', it has been excluded from the percentaging and also from the table.
Table 58
Other Aspects of Children's BehaviourNumber of boys = 4,058; Number of girls = 3,927; Total = 7,985
| Behavioural descriptions | Boys
% | Girls
% | Total
% | Chi-
squared
(Trend)
(1 d.f.) | P value |
| Has difficulty in settling to anything for more than a few moments |
| Frequently | 8.4 | 6.0 | 7.2 | 41.2 | < 0.001 |
| Sometimes | 26.1 | 21.9 | 24.0 |
| Never | 65.5 | 72.0 | 68.7 |
| Prefers to do things on his/her own rather than with others |
| Frequently | 22.9 | 21.9 | 22.4 | 3.8 | > 0.05 (not sig.) |
| Sometimes | 45.9 | 44.7 | 45.3 |
| Never | 31.1 | 33.3 | 32.2 |
| Is bullied by other children |
| Frequently | 5.3 | 4.4 | 4.9 | 24.1 | < 0.001 |
| Sometimes | 32.5 | 27.8 | 30.2 |
| Never | 62.2 | 67.8 | 65.0 |
| Destroys own or others' belongings (e.g. tears or breaks) |
| Frequently | 4.3 | 1.6 | 3.0 | 168.1 | < 0.001 |
| Sometimes | 16.2 | 8.4 | 12.4 |
| Never | 79.5 | 90.0 | 84.7 |
[page 498]
Table 58 (Continued)
| Behavioural descriptions | Boys
% | Girls
% | Total
% | Chi-
squared
(Trend)
(1 d.f.) | P value |
| Is miserable or tearful |
| Frequently | 4.4 | 4.8 | 4.6 | 21.6 | < 0.001 |
| Sometimes | 36.8 | 42.1 | 39.4 |
| Never | 58.8 | 53.1 | 56.0 |
| Is squirmy or fidgety |
| Frequently | 12.9 | 10.3 | 11.6 | 20.3 | < 0.001 |
| Sometimes | 33.3 | 31.4 | 32.4 |
| Never | 53.8 | 58.3 | 56.0 |
| Worries about many things |
| Frequently | 11.5 | 12.3 | 11.9 | 3.0 | > 0.05 (not sig.) |
| Sometimes | 36.0 | 37.1 | 36.6 |
| Never | 52.5 | 50.6 | 51.6 |
| Is irritable, quick to fly off the handle |
| Frequently | 11.9 | 10.9 | 11.4 | 6.9 | 0.01 > p > 0.001 |
| Sometimes | 38.0 | 36.0 | 37.0 |
| Never | 50.1 | 53.1 | 51.6 |
| Sucks thumb or finger during day |
| Frequently | 4.8 | 7.9 | 6.4 | 58.5 | < 0.001 |
| Sometimes | 5.4 | 8.3 | 6.8 |
| Never | 89.8 | 83.7 | 86.8 |
| Is upset by new situation, by things happening for first time |
| Frequently | 5.8 | 5.2 | 5.5 | 1.2 | > 0.05 (not sig.) |
| Sometimes | 22.4 | 24.9 | 23.6 |
| Never | 71.8 | 69.9 | 70.9 |
| Has twitches or mannerisms of the face, eyes or body |
| Frequently | 2.6 | 1.5 | 2.0 | 21.7 | < 0.001 |
| Sometimes | 6.5 | 4.8 | 5.6 |
| Never | 91.0 | 93.7 | 92.3 |
| Fights with other children |
| Frequently | 7.7 | 2.9 | 5.3 | 526.2 | < 0.001 |
| Sometimes | 61.4 | 41.0 | 51.4 |
| Never | 30.8 | 56.1 | 43.3 |
| Bites nails |
| Frequently | 10.5 | 12.6 | 11.5 | 29.7 | < 0.001 |
| Sometimes | 12.0 | 16.1 | 14.0 |
| Never | 77.5 | 71.3 | 74.5 |
| Is disobedient at home |
| Frequently | 4.6 | 3.4 | 4.0 | 60.9 | < 0.001 |
| Sometimes | 60.0 | 52.7 | 56.4 |
| Never | 35.4 | 43.9 | 39.6 |
[page 499]
Of course, the same factors as were discussed in the previous sub-section should be considered in taking account of the above results.
A number of aspects of behaviour appear to be common at this age: disobedience and fighting with other children were reported to occur frequently or sometimes in about 60 per cent of the children. In contrast, twitches or mannerisms were reported in less than eight per cent. The reported incidence of nail-biting (26 per cent) was about half that obtained by Birch (1955) in a local study utilising teachers' reports and more objective criteria. Preferring to do things alone rather than with others stands out as an aspect of behaviour which was reported to occur frequently in a substantial minority of the children (over 22 per cent).
In all but three items, the difference between the sexes was statistically significant or highly significant when tested for trend. The two most marked differences were both in aggressive behaviour; twice as many boys as girls were reported as destroying their own or others' belongings; and about 70 per cent of the boys fought with other children, whilst only 44 per cent of the girls did so. In general, it was the boys who more often showed deviant behaviour, but more of the girls were nail-biters and sucked their thumb or finger during the day.
As with the behaviour difficulties described in the previous sub-section, it is intended to examine the aspects of behaviour discussed here in more detail at a later stage.
4. Summary
(a) On starting at their present school, 94 per cent of the children in 'ordinary' maintained and independent schools in the sample were judged by their teachers to have settled down in school within three months.
There was evidence that girls settled down more quickly than boys in infant classes, but in view of the fact that the data were retrospective and may have been influenced by present behaviour, this conclusion was regarded as tentative.
(b) The evidence was very clear that girls at this age in all categories of school are markedly better adjusted than boys when a relatively crude overall assessment is made in terms of the total score of the Bristol Social-Adjustment Guide.
It was noted that this overall assessment may mask other differences between boys and girls when more specific aspects of behaviour are examined. This more detailed analysis will be done at a later stage.
(c) Approximately 93 per cent of a sub-sample of 7,985 children in all categories of school were reported by their mothers to be happy in school. There was also a highly significant tendency for more girls to be reported as happy at school than boys.
(d) Of the children who had attended a private or local authority nursery class or nursery school, some 94 per cent were reported by their mothers to have settled down within three months of first starting nursery schooling.
Of the children who had not attended a nursery class or nursery school, about 91 per cent were reported by their mothers to have settled down within three months of first starting school.
[page 500]
No statistical analysis was made to test any difference between these two groups of children in relation to the settling down period because a straightforward comparison might have been misleading. No conclusions were therefore drawn.
The evidence from a comparison of the sexes in both groups, however, suggested that girls settled down more quickly than boys.
(e) Percentage figures were given for the reported incidence of nine 'developmental difficulties' for boys and for girls. In only three was there a significant difference between the sexes: there was evidence that more boys than girls are reluctant to go to school; more boys than girls have temper tantrums; and more girls are felt to have poor appetites.
(f) Information was gathered from mothers about 14 other aspects of children's behaviour.
In all but three items there was a significant difference between the sexes in reported incidence. In general, boys at this age are more often reported to show deviant behaviour at home.
References
BIRCH LB The Incidence of Nail-Biting Amongst School Children. Brit. J. Educ. Psychol., Vol. XXV (1955).
CRAWFORD A Department of Psychology, Liverpool University (unpublished communication) (1966).
MINISTRY OF EDUCATION Report of the Committee on Maladjusted Children (HMSO) (1955).
SCOTTISH EDUCATION DEPARTMENT Ascertainment of Maladjusted Children (HMSO) (1964).
STOTT DH The Social Adjustment of Children; Manual to the Bristol Social-Adjustment Guides (University of London Press Ltd.) (1963).
VI: INTERRELATIONSHIP OF THE VARIABLES
A. EDUCATIONAL FACTORS
1. Reading and Arithmetic in Relation to Occupational Group
(a) Introduction
There is overwhelming evidence for a relationship between general socio-economic factors and general educational progress. What are therefore now needed are more investigations of particular aspects of the environment in relation to particular facets of educational progress and, indeed, to child development in general.
At the present stage in this Study there has not been time to examine many aspects of the environment in relation to educational factors; and such statistical analyses as have been carried out have been relatively straightforward. More elaborate analyses will be carried out later.
In this section two facets of educational performance - in reading and in arithmetic - are analysed in relation to the occupational group of the children's fathers or the male head of the household.
(b) Occupational Group and Attainment in Reading
The ability to read is of central importance to children's progress in school. Once mastered, it is a skill which opens many doors. Whilst most schools
[page 501]
now lay more stress upon activities, upon learning through experience and upon oral work in the classroom than was once the case, it remains true that a child who finds reading difficult is gravely handicapped in almost all spheres of his school work.
Other investigations have shown a relationship between the socio-economic level of a child's family and his reading ability, although few studies have been made of this relationship for children in infant schools. It is not difficult to think of reasons for this strong relationship. In general, parents in higher socio-economic groups are more intelligent than those in the other socio-economic groups; thus, their children will tend to be more intelligent and, as a result, better readers. Although no general consensus of opinion exists about the precise contribution which heredity makes towards intellectual functioning, there can be no reasonable doubt that it does playa part (Burt, 1960).
In addition to heredity, and interacting with it, is the influence of the environment in which a child grows. A home in which books and reading material of all kinds are an integral and valued part of daily life is one which is most likely to lay the foundation for the rapid acquisition of reading skill by a child. Reading for him is seen as something which gives his parents enjoyment and which has a purpose. He comes to school, then, wanting to read and may already have made a start.
Motivation is a potent factor, but the influence of the home environment does not rest there. The written word is a symbol which enables the author to convey his thoughts, his ideas and concepts to the reader. If the reader finds difficulty in understanding these thoughts, then any ability to articulate the words will be of little value. True reading ability, then, is more than merely a skill in decoding written symbols; it is an ability to use this skill in understanding what the author is trying to convey. It follows that a home which fosters this true reading ability best is one in which the level of verbal expression is at its highest; where there is a feeling for the spoken word as a tool for conveying precise meaning; where the vocabulary is rich and varied; and where children are stimulated by questions about the world around them and by explanations appropriate to their age.
The factors which have been discussed are complex and extremely difficult to quantify, particularly in large scale investigations such as the present one. Nevertheless, it is reasonable to assume that in general the socio-economic level of the home, much easier to categorise, will be related to these factors. A great deal of information is known about the occupation and education of the parents and the grandparents of the children in the present Study. It is hoped to use this information to arrive at some measure of the social-educational-economic background of the children in order to investigate at a later stage the relationships between this and other factors in the children's development.
Further, it is hoped within the limitations set by the relative crudity of some of the data - virtually inescapable in any large survey - to examine the relationship between particular aspects in the environment and particular facets of children's development. This, however, needs a far more elaborate statistical analysis than there has yet been time to carry out.
As a first step, the relationship is here examined between the occupational groups of the children's fathers - as an index of the socio-economic level of
[page 502]
the family - and one aspect of children's development, namely reading ability. In sub-section (c) of this section the same analysis is made of arithmetical ability.
The results are given in Table 59 for all the children in the present sample in 'ordinary' maintained and independent schools for whom all the requisite information was available. As the index of reading ability, the children's scores on the Southgate Reading Test are used because of their objectivity. Children with a score of 28 or more out of a possible 30 are grouped and operationally defined as 'good readers'; those with a score less than 28 are grouped and called 'medium and poor readers'. Percentage figures only are given in the table below.
Table 59
Southgate Test Score and Occupational Group of the FatherN = 6,834
| Reading groups | Occupational Group | Total |
| 1 | 2 | 3 | 4 | 5 |
| 'Good readers' (Score 28-30) | 56.2 | 54.9 | 36.3 | 31.2 | 23.3 | 40.7 |
| 'Poor and medium readers' (Score < 28) | 43.8 | 45.1 | 63.7 | 68.8 | 76.7 | 59.2 |
| TOTAL | 100 | 100 | 100 | 100 | 100 | 100 |
Chi-squared (Trend) = 289; p < 0.001
Chi-squared (Departure) = 25.7 (3 d.f.); p < 0.001
The difference between the two reading groups in relation to occupational group is highly significant. There is thus clear evidence that in children of this age the lower the 'status' of the fathers' occupations, the poorer the reading attainment of the children. However, there is statistical evidence that this 'falling off' of reading attainment through the occupational groups is not uniform.
An inspection of the table and Figure 8 suggests that this is because there is little difference between the reading performance of children whose fathers have non-manual occupations (occupational groups 1 and 2), but that these children are sharply differentiated from the children whose fathers are skilled, semi-skilled or unskilled workers (occupational groups 3, 4 and 5). Nevertheless, the figures indicate that reading performance continues to 'fall away' through the three manual groups.
Although the overall tendency is clear and statistically highly significant, and the fact of some departure from this general tendency has also been shown, more sophisticated analysis is needed to establish the validity of the speculations advanced in the above paragraph. This analysis will be done at a later stage.
It will be recalled that the Southgate Test is a measure of word recognition and not of reading comprehension. It may be that the relationship between
[page 503]
occupational group and reading for comprehension is stronger than that between occupational group and word recognition. Later analysis of the results for the two other assessments of reading ability obtained in this Study should throw some light on this question.
Figure 6
Southgate Test Performance and Occupational Group of Father
N=6,834
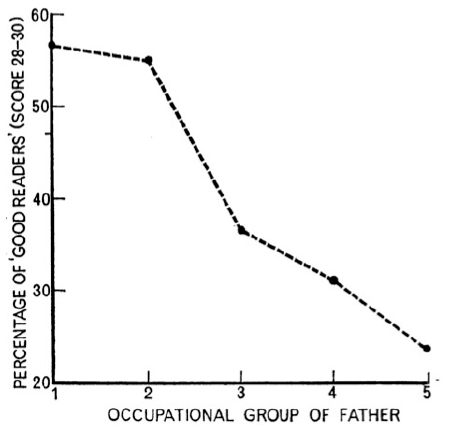 Figure 7
Problem Arithmetic Test Performance and Occupational Group of Father
Figure 7
Problem Arithmetic Test Performance and Occupational Group of Father
N=6,824
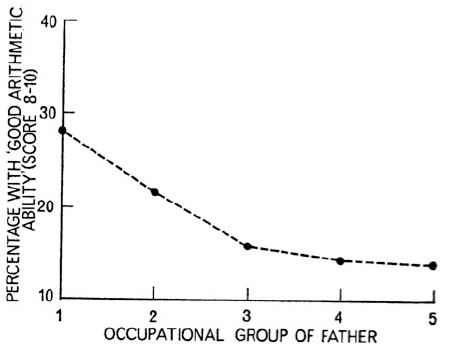
[page 504]
(c) Occupational Group and Attainment in Arithmetic
Much less attention has been given by research workers to the relationship between arithmetic ability and environmental factors, compared with the number of studies of reading. This is understandable since reading plays a more important part in determining children's general progress in school than does arithmetic. Nevertheless, arithmetical ability does impinge upon many other school subjects and it is probably true to say that its importance both in school and in later life will grow along with the rapid technological advances of modern life.
It was decided, therefore, to investigate the relationship between the children's arithmetical ability and environmental factors. As with reading ability, the first step was to examine arithmetical ability in relation to socio-economic status. Again, the occupational group of the father is taken as the index of socio-economic status at this stage. The Problem Arithmetic Test score is used as the measure of arithmetical ability.
The results are given in percentage form in Table 60. All children in the present sample who were in 'ordinary' maintained and independent schools are included where all the requisite data were available. Children with a score on the Problem Arithmetic Test of 8 or more out of a possible 10 are grouped and operationally said to have 'good arithmetical ability'; those with a score of 7 or less have 'medium and poor arithmetical ability'.
Table 60
Problem Arithmetic Test Score and Occupational Group of FatherN = 6,824
| Reading groups | Occupational Group | Total |
| 1 | 2 | 3 | 4 | 5 |
| 'Good arithmetical ability' (Score 8-10) | 28.1 | 21.9 | 15.9 | 14.5 | 14.1 | 18.7 |
| 'Medium and poor arithmetical ability' (Score 0-7) | 71.9 | 78.1 | 84.1 | 85.5 | 85.9 | 81.3 |
| TOTAL | 100 | 100 | 100 | 100 | 100 | 100 |
Chi-squared (Trend) = 103; p < 0.001
Chi-squared (Departure) = 16.6 (3 d.f.); p < 0.001
As the table shows, the proportion of children with 'good arithmetical ability' in the present sample fell from about 28 per cent in Occupational Group 1 to about 14 per cent in Occupational Group 5.
The evidence from the statistical tests is that this tendency is highly significant and one may conclude that in children of this age performance on a test of problem arithmetic is related to the socio-economic status of the family: the lower the status of the fathers' occupational group, the lower the scores of the children. However, as with the corresponding analysis of reading ability, this overall tendency for performance to 'fall away' through the Occupational Groups is not uniform.
[page 505]
An inspection of Table 60 and of Figure 7 showing the pattern of results for children of 'good arithmetical ability' in graph form, suggests that there is a differentiation between children in occupational groups 1,2 and 3 (children of non-manual workers and skilled manual workers) but little, if any, difference between the performance of children in occupational groups 3, 4 and 5 (children of manual workers) in terms of the criteria adopted. However, the comments in the preceding paragraph must remain speculative at this stage. Further statistical analysis must be carried out to clarify the position.
(d) Summary
The evidence from the two preceding sub-sections points clearly to a relationship between the occupational group of children's fathers and children's attainment both in reading and in arithmetic at the age of seven. In both analyses there was evidence that this general relationship is not uniform from one occupational group to another.
These should be seen, however, as two separate analyses; it is not valid to make direct comparisons between the two, even at the speculative level. It will be recalled that the criterion of 'good' reading ability included about 40 per cent of the children, whereas the children with 'good arithmetical ability' were the top 19 per cent of children, as assessed by their scores on the Problem Arithmetic Test.
At a later stage comparisons will be made between reading and arithmetic ability in relation to socio-economic factors, but this will necessitate different and more elaborate statistical techniques.
References
BURT C Interaction of Heredity and Environment in Regard to 'Measured Intelligence'. Brit. J. of Educ. Psychol., Vol. XXX, Part 3 (1960).
B. SCHOOL VARIABLES
1. Length of Schooling, Educational Attainment and Adjustment in School
(a) Introduction
There is evidence from other investigations, reviewed by Pidgeon (1965), that younger children in an age group are at a disadvantage educationally. Thus, summer-born children have been shown to predominate over autumn-born children in the lower streams of schools; in special schools for educationally subnormal children; and in remedial groups for backward readers. It has been suggested that one of the important factors in this situation is the length of schooling received.
Within a given administrative situation most children start their schooling at specified times in the school year, usually at the beginning of a term, according to their dates of birth. In some areas children commence at the beginning of the term in which they attain the age of five or, even, at the beginning of the school year in which they become five; in others they start school at the beginning of the term following their fifth birthday.
However, whatever the procedure, except for one intake of children per year, older children start school first and the younger children follow at intervals during the school year. This means that the older ones have the advantage not only of greater maturity by reason of their age but also of a longer period in school.
[page 506]
Under most circumstances the assessment of the relationship between the length of schooling and subsequent educational performance presents some difficulties because the children who spend the most time in school are also the older ones. Due allowance must therefore be made for the age of the children and, ideally, allowance must also be made for any possible interaction between the age of the children and the length of schooling they have received.
In the present Study, however, the children are all of the same age. An opportunity presented itself, therefore, for examining the educational attainment and social-adjustment of children nearing the end of their infant schooling who were of the same age but had had varying lengths of schooling. It was decided to restrict the analysis to two major groups: those who had started school when aged between 4 years 6 months and 4 years 11 months, and those who started school between the ages of 5 years and 5 years 6 months, as reported by their mothers. Since all of the children in the cohort had their fifth birthday in early March 1963, the latter group would have started school in the summer term 1963, and it is known that the majority of the former children started the term before, in January 1963. These two groups are here referred to as 'early starters' and 'late starters'. Children who had attended a nursery class or a nursery school were excluded from the groups.
In addition, it was decided to take into account the occupations of the children's fathers since this may be an important variable. The occupational group of the father is an indication of the socio-economic status of the family; further, since in general parents of higher socio-economic status are also more intelligent, their children will in general be more intelligent than children of parents in lower occupational groups.
Thus, it is important to ascertain not only whether children with the advantage of an early start in their schooling are doing better in school some two years later, but whether any such relationship exists independent of the socio-economic status of the children's families.
It may be, for example, that the children of professional parents, because of their higher intelligence and the intellectual stimulation in the home, are able to make good the deficit of later starting when compared with children of the same socio-economic status who start school earlier. On the other hand, such children may, because of these same characteristics, be able to maintain an advantage over children of the same socio-economic status who have started later.
Another reason why allowance should be made for the occupational group is that children whose fathers are in, say, occupational groups 4 and 5 are more likely to live in areas where schools are crowded and where there is a particularly acute teacher shortage. In such areas, schools may more often admit children later rather than earlier because of staffing difficulties. If this were the case then a simple comparison between 'early starters' and 'late starters' might produce a spurious result since the latter group might contain a larger proportion of children from lower socio-economic groups. Thus, any difference between the two groups might be associated with socio-economic factors rather than the length of schooling received.
In this section, then, the 'early starters' and the 'late starters' are compared for reading ability as measured by the Southgate Reading Test; for arith-
[page 507]
metical ability, as measured by the Problem Arithmetic Test; and for social-adjustment, as assessed by the total score on the Bristol Social-Adjustment Guide.
Children included are those in the sample in maintained infant, junior with infants or all-age schools, or in independent schools catering wholly or mainly for children who are not handicapped. Children excluded are those who had attended nursery schools and those for whom all the appropriate information was not available when the data were processed (e.g. age of starting school, occupational group of the father).
(b) Length of Schooling and Reading Attainment
(i) Analysis ignoring socio-economic factors
The most straightforward way of examining the relationship between 'early' and 'late' starting in school and reading attainment in the present sample is simply to compare the reading performance of the two groups when they were tested near the end of their infant schooling.
Thus, the children were divided into three categories on the basis of their scores on the Southgate Reading Test: the 'good readers' with a score of 28 to 30; the 'medium readers' with a score from 16 to 27; and the 'poor readers'. The results are given in Table 61.
Table 61
Length of Schooling and Southgate Reading Test ScoreN = 5,251
| Ages of commencing school | Southgate Reading Test score | Total |
'Good readers'
(Score 28-30) | 'Medium readers'
(Score 16-27) | 'Poor readers'
(Score 0-15) |
'Early starters'
4 years 6 months to
4 years 11 months | 43.4 | 43.4 | 13.2 | 100 |
'Late starters'
5 years to
5 years 6 months | 36.2 | 43.6 | 20.3 | 100 |
| TOTAL | 40.0 | 43.5 | 16.5 | 100 |
Chi-squared (Trend) = 52.3; p < 0.001
It will be seen that the 'early starters' were better readers than the 'late starters' when this criterion of reading performance was used. The difference between the groups in reading ability is highly significant.
Thus, one may conclude that children of the same age who make an earlier start with their schooling (aged 4 years 6 months to 4 years 11 months) are better readers, as measured by a test of word recognition, near the end of their infant schooling than those who make a later start (aged 5 years to 5 years 6 months). In the present sample the difference in the length of schooling between the two groups compared was, for the majority of the children, only one term.
(ii) Analysis allowing for socio-economic factors
Although the overall relationship between length of schooling and reading ability at seven years of age has been demonstrated, this relationship may not be the same for children from all socio-economic backgrounds.
[page 508]
In Table 62 the 'early starters' and 'late starters' are grouped according to the occupational group of their fathers. Further, the particular statistical analysis used necessitated dividing the children into two groups according to their reading ability. It was decided that it would be most appropriate to compare the 'good readers' with the 'medium and poor' readers.
Table 62
Occupational Group of the Father, Length of Schooling and Southgate Reading Test ScoreN = 5,251
| Southgate Reading Test score | |
Occupational
groups | Ages of
commencing
school | 'Good'
readers
(Score 28-30) | 'Medium' and
'poor' readers
(Score 0-27) | Total |
| 1 | 'Early starters'
4 yrs. 6 mths. to
4 yrs. 11 mths. | 58.0 | 42.0 | 100 |
'Late starters'
5 yrs. to
5 yrs. 5 mths. | 47.8 | 52.3 | 100 |
| 2 | 'Early starters'
4 yrs. 6 mths. to
4 yrs. 11 mths. | 61.9 | 38.1 | 100 |
'Late starters'
5 yrs. to
5 yrs. 5 mths. | 51.2 | 48.8 | 100 |
| 3 | 'Early starters'
4 yrs. 6 mths. to
4 yrs. 11 mths. | 39.2 | 60.8 | 100 |
'Late starters'
5 yrs. to
5 yrs. 5 mths. | 36.7 | 67.3 | 100 |
| 4 | 'Early starters'
4 yrs. 6 mths. to
4 yrs. 11 mths. | 33.1 | 66.9 | 100 |
'Late starters'
5 yrs. to
5 yrs. 5 mths. | 28.2 | 71.8 | 100 |
| 5 | 'Early starters'
4 yrs. 6 mths. to
4 yrs. 11 mths. | 25.7 | 74.3 | 100 |
'Late starters'
5 yrs. to
5 yrs. 5 mths. | 22.5 | 77.5 | 100 |
| TOTAL | 40.0 | 60.0 | 100 |
Chi-squared (partial association) = 29.1; p < 0.001
Chi-squared (2nd order interaction) = 1.94 (4 d.f.); p > 0.05 not significant
[page 509]
It will be seen that in each occupational group the 'early starters' had a higher proportion than the 'late starters' of 'good readers' and a smaller proportion of children of 'medium and poor' reading ability.
The evidence from the two statistical tests carried out (see Section IV: 'Statistical Analysis ') is that there is a highly significant difference between the 'early starters' and the 'late starters', independent of occupational group.
Thus, the conclusion is warranted that children of the same age who start school 'early' (aged 4 years to 4 years 11 months) are better readers near the end of their infant schooling - irrespective of the occupational groups of their fathers - than children who start school 'late' (aged 5 years to 5 years 5 months).
(c) Length of Schooling and Arithmetic Attainment
(i) Analysis ignoring socio-economic factors
Once again the most straightforward analysis is presented first.
The 'early starters' and 'late starters' were divided into three categories according to their score on the Problem Arithmetic Test. Those with a score of 8 to 10 were defined as having 'good arithmetical ability'; those scoring from 3 to 7 had 'medium arithmetical ability'; and the children scoring 2 or below were defined as having 'poor arithmetical ability'.
The percentaged results are given in Table 63.
Table 63
Length of Schooling and Problem Arithmetic Test ScoreN = 5,242
| Ages of commencing school | Problem arithmetic test score | Total |
'Good
arithmetical
ability'
(Score 8-10) | 'Medium
arithmetical
ability'
(Score 3-7) | 'Poor
arithmetical
ability'
(Score 0-2) |
'Early starters'
4 yrs. 6 mths. to
4 yrs. 11 mths. | 19.9 | 66.3 | 13.8 | 100 |
'Late starters'
5 yrs. to
5 yrs. 5 mths. | 16.1 | 66.1 | 17.8 | 100 |
| TOTAL | 18.1 | 66.2 | 15.7 | 100 |
Chi-squared (Trend) = 23.7; p < 0.001
The difference between the 'early starters' and 'late starters' in arithmetical ability, as measured by this test, is highly significant.
Thus, if no account is taken of socio-economic factors, the conclusion is warranted that children of the same age who start school 'early' (aged 4 years 6 months to 4 years 11 months) achieve better scores on a problem arithmetic test near the end of their infant schooling than children who start school 'late' (aged 5 years to 5 years 5 months).
[page 510]
(ii) Analysis allowing for socio-economic factors
As with reading ability, a more detailed analysis was carried out which allowed for socio-economic factors in so far as these are assessed by the occupational groups of the fathers.
Table 64
Occupational Group of the Father, Length of Schooling and Problem Arithmetic Test ScoreN = 5,242
| Problem Arithmetic Test score | |
Occupational
groups | Ages of
commencing
school | 'Good
arithmetical
ability'
(Score 8-10) | 'Medium and poor
arithmetical
ability'
(Score 0-7) | Total |
| 1 | 'Early starters'
4 yrs. 6 mths. to
4 yrs. 11 mths. | 28.2 | 71.8 | 100 |
'Late starters'
5 yrs. to
5 yrs. 5 mths. | 22.7 | 77.3 | 100 |
| 2 | 'Early starters'
4 yrs. 6 mths. to
4 yrs. 11 mths. | 24.8 | 75.3 | 100 |
'Late starters'
5 yrs. to
5 yrs. 5 mths. | 21.0 | 79.0 | 100 |
| 3 | 'Early starters'
4 yrs. 6 mths. to
4 yrs. 11 mths. | 17.6 | 82.4 | 100 |
'Late starters'
5 yrs. to
5 yrs. 5 mths. | 14.0 | 86.1 | 100 |
| 4 | 'Early starters'
4 yrs. 6 mths. to
4 yrs. 11 mths. | 15.2 | 84.9 | 100 |
'Late starters'
5 yrs. to
5 yrs. 5 mths. | 13.6 | 86.4 | 100 |
| 5 | 'Early starters'
4 yrs. 6 mths. to
4 yrs. 11 mths. | 17.1 | 82.9 | 100 |
'Late starters'
5 yrs. to
5 yrs. 5 mths. | 10.6 | 89.4 | 100 |
| TOTAL | 18.1 | 81.9 | 100 |
Chi-squared (partial association) = 12.8; p < 0.001
Chi-squared (2nd order interaction) = 1.4 (4 d.f.); p > 0.05 not significant
[page 511]
For this statistical analysis it was necessary to place the children into two groups on the basis of their scores on the Problem Arithmetic Test. It was decided, as with the corresponding analysis of reading ability, to place the children with 'good arithmetic ability' (with a score of 8 to 10) in one group; and those with 'medium and poor arithmetic ability' (with a score below 8) in the other.
The percentage figures are given in Table 64.
There was a higher proportion of 'early starters' than 'late starters' in each occupational group with 'good arithmetical ability' and a smaller proportion with 'medium and poor' arithmetical ability.
The evidence from the two statistical tests carried out (see Section IV: 'Statistical Analysis ') is that there is a highly significant difference between the 'early starters' and the 'late starters', independent of occupational group.
The conclusion is warranted that, in terms of performance on a test of problem arithmetic, children of the same age who start school 'early' are as a group more advanced near the end of their infant schooling than children who start school 'late', irrespective of the occupational group of their fathers.
(d) Length of Schooling and Adjustment in School
(i) Analysis ignoring socio-economic factors
As in the previous two sub-sections, the simplest analysis is presented first; 'early starters' and 'late starters' are compared in terms of their adjustment in school without regard for any factors except for the length of their schooling.
The two groups were divided into three categories on the basis of total scores on the Bristol Social-Adjustment Guides. Those with a score from 0 to 9 were called 'stable'; those with a score between 10 and 19 were operationally defined as 'unsettled'; and those with a score of 20 or more were called 'maladjusted' .
The results in percentage form are given in Table 65. It will be noted that the total number of children involved in this analysis is some 300 less than in
Table 65
Length of Schooling and Adjustment in SchoolN = 4,917
| Ages of commencing school | Adjustment in school | Total |
'Stable'
Total Score 0-9 | 'Unsettled'
Total Score 10-19 | 'Maladjusted'
Total Score 20+ |
'Early starters'
4 yrs. 6 mths. to
4 yrs. 11 mths. | 69.5 | 19.7 | 10.8 | 100 |
'Late starters'
5 yrs. to
5 yrs. 5 mths. | 64.9 | 22.6 | 12.4 | 100 |
| TOTAL | 67.4 | 21.1 | 11.6 | 100 |
Chi-squared (Trend) = 9.9; 0.01 > p > 0.001
[page 512]
the corresponding analyses for reading and arithmetic. This is because fewer Bristol Social-Adjustment Guides were available for data processing when this was carried out.
As the above table shows, there was a higher proportion of 'stable' children amongst the 'early starters' and a smaller proportion of 'unsettled' and 'maladjusted' children. The difference between the 'early starters' and the 'late starters' is statistically significant, in percentage form.
There is thus evidence that in terms of the criteria adopted, children of the same age who start school 'early' are better adjusted in school near the end of their infant schooling than children who start school 'late'.
(ii) Analysis allowing for socio-economic factors
In Table 66 results are given, separately, for 'early starters' and 'late starters' in the five occupational groups.
The difference between the adjustment in school of 'early starters' and 'late starters' was analysed independent of the occupational group of their fathers. In order to carry out this particular statistical analysis, 'unsettled' and 'maladjusted' children were grouped together to contrast with 'stable' children.
[page 513]
Table 66
Occupation of the Father, Length of Schooling and Adjustment in School (percentaged)N = 4,917
| Adjustment in school | |
Occupational
groups | Ages of
commencing
school | 'Stable'
Total score 0-9 | 'Unsettled and maladjusted'
Total score 10+ | Total |
| 1 | 'Early starters'
4 yrs. 6 mths. to
4 yrs. 11 mths. | 75.0 | 25.0 | 100 |
'Late starters'
5 yrs. to
5 yrs. 5 mths. | 72.7 | 27.3 | 100 |
| 2 | 'Early starters'
4 yrs. 6 mths. to
4 yrs. 11 mths. | 78.1 | 21.9 | 100 |
'Late starters'
5 yrs. to
5 yrs. 5 mths. | 76.2 | 23.8 | 100 |
| 3 | 'Early starters'
4 yrs. 6 mths. to
4 yrs. 11 mths. | 68.6 | 31.4 | 100 |
'Late starters'
5 yrs. to
5 yrs. 5 mths. | 63.9 | 36.1 | 100 |
| 4 | 'Early starters'
4 yrs. 6 mths. to
4 yrs. 11 mths. | 64.0 | 36.0 | 100 |
'Late starters'
5 yrs. to
5 yrs. 5 mths. | 58.5 | 41.5 | 100 |
| 5 | 'Early starters'
4 yrs. 6 mths. to
4 yrs. 11 mths. | 59.3 | 40.7 | 100 |
'Late starters'
5 yrs. to
5 yrs. 5 mths. | 46.9 | 53.1 | 100 |
| TOTAL | 67.4 | 32.6 | 100 |
Chi-squared (partial association) = 11.3; p < 0.001
Chi-squared (2nd order interaction) = 2.06 (4 d.f.); p > 0.05 not significant
It will be seen that in each occupational group there was a higher proportion of 'stable' children amongst the 'early starters' and a smaller proportion of 'unsettled and maladjusted' children.
The evidence from the two statistical tests (see Section IV: 'Statistical Analysis ') is that there is a highly significant difference between the adjust-
[page 514]
ment in school of the 'early starters' when compared on this criterion with that of the 'late starters'.
One may conclude that children of the same age who start school 'early' are better adjusted in school near the end of their infant schooling than those who start school 'late', irrespective of the occupational group of their fathers.
(e) Summary
The highly significant results obtained in the three previous sub-sections only permit one, strictly, to make inferences in terms of the assessments used. Nevertheless, the conclusion is warranted that children of the same age who commence full-time infant schooling before the age of five are, as they approach the transfer to junior schools or classes some two years later, more advanced educationally and better adjusted in school than those who commence school after the age of five, irrespective of the socio-economic status of their families.
It must be borne in mind that this relationship is not necessarily a causal one; one cannot conclude without further evidence that the relatively poorer performance of later starters is the direct effect of less time spent in school. It may be that both the age of commencing school and educational attainment at seven years of age are related to another factor or factors. For example, if it were true that earlier starting in school were more common in the south of England than in the north and also that educational standards were higher in the south, this may account wholly, or partly, for the demonstrated relationship. This regional factor, and others, will be investigated at a later stage. It may be thought that even if a causal relationship could be demonstrated, the topic is of academic interest and has few practical implications since in a given area it is normal for children of the same age to start school at the same time. Further, any effect of length of schooling might be assumed to diminish and even to disappear as children grow older.
Nevertheless, despite the fact that children of the same age in a particular area generally start school at the same time, some borderline has to be drawn and children whose ages differ by only a few days or weeks have different lengths of time in school.
Furthermore, since there is evidence (Pidgeon, 1965) that younger children in an age group are at a disadvantage, educationally, compared with older ones, it is important to investigate the factors which contribute to this situation. If the length of schooling is one of these factors, then it may be possible to take practical steps to ameliorate the position.
Finally, although it appears to be a reasonable assumption that any effects of length of schooling may diminish with time, the assumption would need to be verified. It may not be true for all children under all circumstances. For example, the importance of the children's level of intelligence may be an important factor, as may the size of organisation of the junior schools or departments which they transfer.
References
PIDGEON DA Date of Birth and Scholastic Performance. Educational Research, Vol. 8, No.1 (National Foundation for Educational Research) (1965).
[page 515]
C. ENVIRONMENTAL FACTORS
1. Parental Situation
(a) Introduction
Research evidence supports the thesis that the general progress of children who are not living with both their own natural parents is likely to be less satisfactory than that of children who are. The greater part of research in this country is based on findings from children who have shown difficulties which have required special action. The present Study provides an opportunity to compare children living in 'atypical' family circumstances, irrespective of whether or not they are receiving any specialised help, with a large group of children of the same age and otherwise similar background. For the sake of brevity the group of children living with their own parents will be described as 'normal' and those not living with both natural parents will be described as 'atypical'.
It might be expected that a comparison of the children from 'normal' family settings with those from 'atypical' ones would show certain differences in growth and development. Children not living with both natural parents are more likely to have been subject to adverse experiences which may play an important part in their emotional development or their general progress. Both the total set of circumstances that lead to children living in an 'atypical' parental situation and the children's growth and development within the 'atypical' setting are likely to be associated with socio-economic status. Comparisons were made, therefore, between children from 'normal' and 'atypical' home backgrounds for reading ability as a major indication of progress at school. The comparison between the two groups was made for boys and girls and within occupational group. The proportions of the children living in 'normal' and 'atypical' parental situations within each occupational group are given in part (b) of this section.
The 'normal' group included those children reported by their mothers to be living with or cared for by both natural parents. The 'atypical' group covered children reported as having only one natural parent because of illegitimacy, desertion, divorce, separation or death; those with one step-parent; as well as children who were adopted, fostered or in care. Children whose parental situation was not known have been excluded from this second group, although it is likely that a number of them will eventually be found to belong to it. An analysis of the different types of parental situation within the 'atypical' group in relation to other factors will be possible at a future stage.
Information about the children's families was gathered on the Parental Questionnaires. In the totals from the punched card analysis (see Section V: 'Environmental Factors') six per cent of the children for whom there was information were living in an 'atypical' situation. This is likely to be an underestimate of the proportion in the total cohort because mothers of children with no male head of household are more likely to be in full-time work, so that in consequence their completed Parental Questionnaires would have a greater chance of being among the 'late' returns not included in the present sample.
In this section the totals were all derived from computer analysis and will vary according to the number of children within the two groups for whom there was appropriate information. All the analyses were of children both in
[page 516]
'ordinary' maintained and independent schools and of children in 'special' schools. The 82 children whose schools could not be classified and the very few who were resident in hospital were not included.
The two groups of children were compared wherever possible for three variables: sex; occupational groups of the fathers; and Southgate Reading Test Scores. Two-way tables showing the position in the sample as a whole are given before tables showing three way breakdowns.
(b) Parental Situation and Occupational Groups
About a third of the children living in an 'atypical' family situation were those without a father or a male head of household and so could not be included in the results presented in Table 67. (It is realised that this group of children in households without fathers may have some special characteristics.)
Table 67
Occupational Group of Fathers by Parental SituationN = 6,896
Occupational
Groups | Parental
situation | N | Per cent |
| 1 | 'Normal' | 1,355 | 97.3 |
| 'Atypical' | 37 | 2.7 |
| 2 | 'Normal' | 719 | 96.1 |
| 'Atypical' | 29 | 3.9 |
| 3 | 'Normal' | 3,068 | 95.8 |
| 'Atypical' | 136 | 4.2 |
| 4 | 'Normal' | 1,109 | 94.8 |
| 'Atypical' | 61 | 5.2 |
| 5 | 'Normal' | 356 | 93.2 |
| 'Atypical' | 26 | 6.8 |
| All | 'Normal' | 6,607 | 95.8 |
| 'Atypical' | 289 | 4.2 |
Chi-squared (Trend) = 17.1; p < 0.001
Chi-squared (Departure) = 0.8 (3 d.f.); p > 0.05 not significant
The proportion of children living in an 'atypical' family situation showed a highly significant and consistent increase from occupational group 1 through to occupational group 5. Of the children in occupational group 1, 2.7 per cent were not living with their own parents, compared with 6.8 per cent of children in occupational group 5.
(c) Parental Situation and Southgate Reading Test Score
The association between Reading Score and Parental Situation was tested for boys and girls separately. The children's scores on the Southgate Reading Test (for detailed description see Section III: B.3) were classified into three groups:
[page 517]
'Poor readers' with a score from 0 to 15;
'Medium readers' with a score from 16 to 27; and
'Good readers' with a score from 28 to 30.
Table 68
Parental Situation and Southgate Reading Test for BoysN = 3,448
Parental
situation | 'Poor readers'
Score 0-15 | 'Medium readers'
Score 16-27 | 'Good readers'
Score 28-30 | Total |
| N | Per cent | N | Per cent | N | Per cent | N | Per cent |
| 'Normal' | 684 | 20.7 | 1,446 | 43.8 | 1,170 | 35.4 | 3,300 | 100 |
| 'Atypical' | 43 | 29.0 | 71 | 48.0 | 34 | 23.0 | 148 | 100 |
Chi-squared (Trend) = 11.3; p < 0.001
Chi-squared (Departure) = 0.2 (1 d.f.); p > 0.05 not significant
There was a highly significant association between the two parental situation groups and the three reading groups. More boys in the 'normal' group had high reading scores (35.4 per cent) than those in the 'atypical' group (23 per cent) and, conversely, among the latter the proportion of 'poor readers' was higher; 29 per cent compared with 20.7 per cent.
Table 69
Parental Situation and Southgate Reading Test for GirlsN = 3,404
Parental
situation | 'Poor readers'
Score 0-15 | 'Medium readers'
Score 16-27 | 'Good readers'
Score 28-30 | Total |
| N | Per cent | N | Per cent | N | Per cent | N | Per cent |
| 'Normal' | 403 | 12.3 | 1,326 | 40.6 | 1,537 | 47.1 | 3,266 | 100 |
| 'Atypical' | 22 | 15.9 | 69 | 50.0 | 47 | 34.1 | 138 | 100 |
Chi-squared (Trend) = 7.7; 0.01 > p > 0.001
Chi-squared (Departure) = 1.3 (1 d.f.); p > 0.05 not significant
For girls, the same overall pattern was found; there is a significant association with reading in the two groups with a higher proportion of girls who were 'good readers' (47.1 per cent) in the 'normal' group than in the' atypical' group (34.1 per cent).
(d) Parental Situation, Occupational Group and Southgate Reading Test Score
Three occupational groups were formed for this analysis, as at this stage in the Study the numbers of children in the 'atypical' group were too small for a five-fold classification. The two non-manual occupational groups (1 and 2) formed the first new grouping and the partly skilled and unskilled workers in occupational groups 4 and 5 formed the second new grouping.
[page 518]
Table 70
Occupational Group, Parental Situation and Southgate Test Score
(Boys and girls combined)N = 6,851
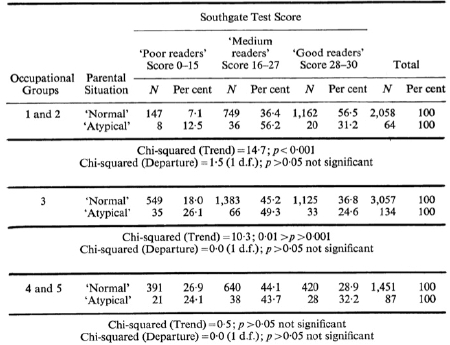 [click on the image for a larger version]
For occupational groups 1 and 2 combined, as well as for occupational group 3, the difference in the children's reading scores in the two parental situations was highly significant or significant; children in the 'normal' group had consistently higher reading scores than those in the 'atypical' group. However, in occupational groups 4 and 5 this was not the case, there being no significant difference in the reading scores of the 'atypical' and 'normal' groups.
Two possible interpretations of this result are, first, that an 'atypical' parental situation may be only one of a number of potentially adverse environmental factors which occur relatively more often in occupational groups 4 and 5 and so is less discernible as a factor in isolation in relation to the children's reading progress. Secondly, it is possible that the patterns of family and neighbourhood life in these two occupational groups mitigate some of the possible difficulties of children in an 'atypical' situation.
(e) Summary
(i) There was evidence from the present Study of an association between parental situation and socio-economic status; there being a consistent tendency for the number of 'atypical' parental situations to increase from occupational group 1 through to occupational group 5.
[page 519]
(ii) An association was demonstrated between poor reading ability and 'atypical' parental situation which was highly significant for boys and significant for girls.
(iii) There was a highly significant association between reading ability and parental situation for occupational groups 1 and 2 combined and a significant association with occupational group 3; the 'normal' group showing better reading ability. However, there was no such association within occupational groups 4 and 5 combined.
2. Parental Approach
(a) Introduction
Parental attitudes to their children's education are related to children's progress in school (for example, Fraser, 1959; Douglas, 1964). Douglas gives evidence that this relationship is highly correlated with his index of socio-economic status; further, the relationship still holds good within the different social classes, irrespective 'of standards of living, size of family and academic record of the school'.
The children in the present Study are somewhat younger than those in the majority of studies on this subject. Only one criterion of parental interest could be used at this stage of the Study. The objective fact, as reported by head teachers, of whether or not parents had initiated discussion about their children was preferred to the more subjective assessment of the parents' interest made by the teachers. Initiating discussion with their children's teachers is only one indication of parents' concern, and there will be some parents who find it more difficult to visit the school than others; for example, mothers with other children who are very young. The over-anxious or over-concerned mother who tends to make too frequent enquiries cannot be differentiated under this criterion either.
Head teachers were asked: 'Since September 1964 have the parents taken the initiative to discuss the child, even briefly, with you or any member of your teaching staff?'
For the sake of brevity, children whose parents had initiated discussion will be described as the 'Approached' group and those whose parents had not initiated discussion will be described as the 'Not Approached' group.
The replies analysed in the tables in this section concern children both in 'ordinary' maintained and independent schools and in 'special schools'. The children whose schools could not be classified or who were resident in hospitals were not included.
The association between parental approach and the children's progress has been tested in relation to one major factor in educational progress, namely reading ability. The reading ability of children in the two groups ('Approached'/'Not Approached') was considered in relation to sex and occupational group.
(b) Parental Approach and Occupational Group
The results in Table 72 show that about 70 per cent of parents in occupational group 1 initiated discussion with teachers, compared with some 46 per cent in occupational group 5. In all occupational groups, except occupational group 5, a higher proportion of parents had initiated discussion than had not.
[page 520]
Table 71
Occupational Group of Father and Parental Approach
(Boys and girls combined)N = 6,896
Occupational
Group | Parental
approach | N | Per cent |
| 1 | 'Approached' | 984 | 70.7 |
| 'Not approached' | 408 | 29.3 |
| 2 | 'Approached' | 494 | 65.9 |
| 'Not approached' | 255 | 34.0 |
| 3 | 'Approached' | 1,727 | 54.0 |
| 'Not approached' | 1,473 | 46.0 |
| 4 | 'Approached' | 644 | 54.9 |
| 'Not approached' | 529 | 45.1 |
| 5 | 'Approached' | 177 | 46.3 |
| 'Not approached' | 205 | 53.7 |
| TOTAL | 'Approached' | 4,026 | 58.4 |
| 'Not approached' | 2,870 | 41.6 |
Chi-squared (Trend) = 134.8; p < 0.001
Chi-squared (Departure) = 24.0 (3 d.f.); p < 0.001
The results of the statistical test (trend) showed that there is a highly significant tendency for the proportion of parents who have approached the school to decrease from occupational group 1 through to occupational group 5. However, the statistical test for departure from a linear relationship showed that this overall tendency is not consistent through all the paternal occupational groups and, thus, that the decrease from one occupational group to another in the proportion of parents who have approached the school is not uniform.
An inspection of the table indicates that this departure from the overall tendency for 'parental approach' to fall through the occupational groups is because the proportions in the 'Approached' and 'Not Approached' groups in occupational group 3 and occupational group 4 are virtually the same.
(c) Parental Approach and Southgate Reading Test Score
The children included in the following tables were those with Parental Questionnaires returned completed in time for analysis for this Report.
The association between reading score and Parental Approach was tested for the total sub-sample and then for boys and girls separately. The children's scores on the Southgate Reading Test (for detailed description see Section III B.3) were classified into three groups: 'Poor readers' - scoring 0 to 15 on this test; 'Medium readers' - scoring 16 to 27; and 'Good readers' scoring 28 to 30.
[page 521]
Table 72
Parental Approach and Southgate Reading Test Score
(Boys and girls combined)N = 6,803
Parental
approach | 'Poor readers'
Score 0-15 | 'Medium readers'
Score 16-27 | 'Good readers'
Score 28-30 | Total |
| N | Per cent | N | Per cent | N | Per cent | N | Per cent |
| 'Approached' | 551 | 13.8 | 1,632 | 40.8 | 1,815 | 45.4 | 3,998 | 100 |
| 'Not approached' | 599 | 21.3 | 1,265 | 45.1 | 941 | 33.5 | 2,805 | 100 |
Chi-squared (Trend) = 110.7; p < 0.001
Chi-squared (Departure) = 0.2 (1 d.f.); p > 0.05 not significant
There were significantly more 'good readers' and fewer 'poor readers' and 'medium readers' in the 'Approached' group than in the 'Not Approached' group for all the children in this sub-sample.
Table 73
Parental Approach and Southgate Reading Test Score
(Boys only)N = 3,402
Parental
approach | 'Poor readers'
Score 0-15 | 'Medium readers'
Score 16-27 | 'Good readers'
Score 28-30 | Total |
| N | Per cent | N | Per cent | N | Per cent | N | Per cent |
| 'Approached' | 351 | 17.2 | 881 | 43.1 | 811 | 39.7 | 2,043 | 100 |
| 'Not approached' | 375 | 27.6 | 622 | 45.8 | 362 | 26.6 | 1,359 | 100 |
Chi-squared (Trend) = 83.1; p < 0.001
Chi-squared (Departure) = 0.0 (1 d.f.); p > 0.05 not significant
Table 74
Parental Approach and Southgate Reading Test Score
(Girls only)N = 3,301
Parental
approach | 'Poor readers'
Score 0-15 | 'Medium readers'
Score 16-27 | 'Good readers'
Score 28-30 | Total |
| N | Per cent | N | Per cent | N | Per cent | N | Per cent |
| 'Approached' | 200 | 10.2 | 751 | 38.4 | 1,004 | 51.4 | 1,955 | 100 |
| 'Not approached' | 224 | 15.5 | 643 | 44.5 | 579 | 40.0 | 1,446 | 100 |
Chi-squared (Trend) = 48.2; p < 0.001
Chi-squared (Departure) = 0.6 (1 d.f.); p > 0.05 not significant
[page 522]
The results in Tables 73 and 74 show that both for boys and for girls there is a highly significant association between reading ability and parental interest, as assessed by these criteria. In the 'Approached' group about 40 per cent of boys and 51.4 per cent of girls were 'good readers', compared with 26.6 per cent of boys and 40 per cent of girls who are 'good readers' in the 'Not Approached' group.
(d) Parental Approach and Southgate Reading Test Score within Occupational Groups
As can be seen in Table 75, for the boys in each occupational group the proportion of 'good readers' in the 'Approached' group was higher than
Table 75
Occupational Groups, Parental Approach and Southgate Reading Test Score
(Boys only)N = 3,402
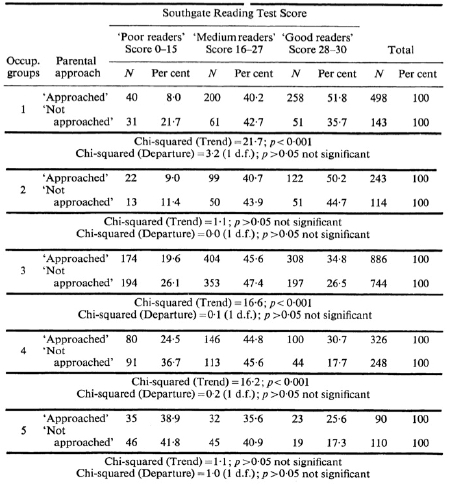 [click on the image for a larger version]
[page 523]
the proportion of 'good readers' in the 'Not Approached' group. Conversely, the proportion of 'poor readers' is lower in the 'Approached' group than in the 'Not Approached' group in each occupational group. For example, in occupational group 1, about 52 per cent in the 'Approached' group were 'good readers', compared with 36 per cent in the 'Not Approached' group; and only eight per cent were 'poor readers' in the 'Approached' group, compared with 21 per cent in the 'Not Approached' group.
For each occupational group a statistical test was carried out to determine whether the difference between the reading performance of the two groups was significant. The difference was highly significant for occupational groups 1, 3 and 4. Thus, in these three occupational groups, and in terms of the criteria adopted, children whose parents initiated discussion with teachers are better readers than those whose parents did not.
In occupational groups 2 and 5 the results of the statistical testing were not significant, although the differences were in the same direction as in the other three occupational groups. These results may be due to the relatively smaller number of boys in occupational groups 2 and 5. Further interpretation of these results must await more detailed statistical treatment.
Inspection of Table 75 also suggests a difference in 'parental approach' between the parents of 'poor readers' in the manual and non-manual occupational groups.
In occupational groups 1 and 2 more (numerically) of the parents whose children were 'poor readers' were in the 'Approached' group than in the 'Not Approached' group. In occupational groups 3, 4 and 5, however, the reverse was the case, with fewer parents of 'poor readers' in the 'Approached' group than in the 'Not Approached' group.
Table 76
Occupational Groups, Parental Approach and Southgate Reading Test Score
(Girls only)N = 3,401
Occup.
groups | Parental
approach | Southgate reading test score | Total |
'Poor readers'
Score 0-15 | 'Medium readers'
Score 16-27 | 'Good readers'
Score 28-30 |
| N | Per cent | N | Per cent | N | Per cent | N | Per cent |
| 1 | 'Approached' | 17 | 3.6 | 147 | 30.9 | 311 | 65.5 | 475 | 100 |
| 'Not approached' | 17 | 7.9 | 76 | 35.3 | 122 | 56.7 | 215 | 100 |
Chi-squared (Trend) = 7.4; 0.01 > p > 0.001
Chi-squared (Departure) = 0.9 (1 d.f.); p > 0.05 not significant |
| 2 | 'Approached' | 12 | 4.8 | 80 | 31.9 | 159 | 63.3 | 251 | 100 |
| 'Not approached' | 3 | 2.2 | 58 | 42.3 | 76 | 55.5 | 137 | 100 |
Chi-squared (Trend) = 0.8; p > 0.05 not significant
Chi-squared (Departure) = 4.4 (1 d.f.); 0.05 > p > 0.01 not significant |
[page 524]
| 3 | 'Approached' | 101 | 12.1 | 354 | 42.3 | 382 | 45.6 | 837 | 100 |
| 'Not approached' | 115 | 16.0 | 336 | 46.6 | 270 | 37.4 | 721 | 100 |
Chi-squared (Trend) = 11.8; p < 0.001
Chi-squared (Departure) = 0.3 (1 d.f.); p > 0.05 not significant |
| 4 | 'Approached' | 47 | 15.3 | 133 | 43.3 | 127 | 41.4 | 307 | 100 |
| 'Not approached' | 57 | 20.4 | 132 | 47.3 | 90 | 32.3 | 279 | 100 |
Chi-squared (Trend) = 5.8; 0.05 > p > 0.01 not significant
Chi-squared (Departure) = 0.2 (1 d.f.); p > 0.05 not significant |
| 5 | 'Approached' | 23 | 27.1 | 37 | 43.5 | 25 | 29.4 | 85 | 100 |
| 'Not approached' | 32 | 34.0 | 41 | 43.6 | 21 | 22.3 | 94 | 100 |
Chi-squared (Trend) = 1.6; p > 0.05 not significant
Chi-squared (Departure) = 0.0 (1 d.f.); p > 0.05 not significant |
As will be seen in Table 76, the overall pattern of results was similar to that of the boys. In each occupational group a higher proportion of girls in the 'Approached' group were 'good readers', compared with the proportion of 'good readers' in the 'Not Approached' group. There was a lower proportion of 'poor readers' in four of the occupational groups among the children whose parents had approached the school than among the children of parents who had not initiated discussion.
Statistical evidence showed the differences between the two groups, 'Approached' and 'Not Approached', to be highly significant in occupational group 3 and to be significant in occupational group 1. The difference between the two groups approached the level of statistical significance in occupational group 4. As with the boys, the differences in reading ability were not significant between the two groups of 'parental approach' in occupational groups 2 and 5.
The results presented in Tables 75 and 76 above indicate that the criterion of 'parental approach' as an index of parental interest is associated with reading ability and that this association both for boys and for girls is to some extent independent of socio-economic factors. However, the association justifies a more elaborate statistical approach, which should also take account of the other data on parental interest which are available.
(e) Summary
(i) There is a highly significant tendency for the proportion of parents who have approached the school to decrease from occupational group 1 through to occupational group 5, although this trend is not wholly consistent.
(ii) The differences between the 'Approached' group and the' Not Approached' group are highly significant in relation to reading scores for the boys and for the girls. Boys and girls in the 'Approached' group have better reading ability than in the 'Not Approached' group.
[page 525]
(iii) The differences tended to be in a similar direction within occupational groups for boys and girls in relation to reading scores. The differences between the 'Approached' group and the 'Not Approached' group were significant in relation to reading scores for boys and girls separately in occupational groups 1 and 3 and for boys in occupational group 4.
References
DOUGLAS JWB The Home and the School (McGibbon and Kee) (1964).
FRASER ED Home Environment and the School (University of London Press) (1959).
D. BEHAVIOUR AND ADJUSTMENT
Adjustment in School in Relation to Occupational Group
The relationship between children's emotional and social adjustment and other factors is one of the most important yet complex aspects of child development. It is important because of its practical implications, not only for children's progress in school and general happiness in childhood, but also for their later integration into adult society, for their careers and their own adequacy as parents; it is complex not only because there are many factors involved which interact with each other, but also because most of these factors are difficult to 'measure' in a meaningful way.
In this section the children's adjustment in school, as assessed by the total score on the Bristol Social-Adjustment Guides, is related to the occupational group of their fathers. As has been explained elsewhere in this Report, the occupational group is seen as a crude index of the socio-economic status of the family. This variable might seem to be less relevant to a consideration of children's adjustment than, say, to their reading attainment. Certainly, the possibility of a close relationship with attainment in school seems more predictable. The general level of verbal skills, the intellectual stimulation and professional and leisure interests of parents in non-manual occupations contrast sharply with the general pattern to be found in many homes of unskilled manual workers. But what of emotional and social adjustment? It seems likely, as was indicated in the opening paragraph, that any relationship between adjustment and socio-economic factors will be more complex. A number of studies have shown that patterns of child rearing differ between 'social classes'. It is unlikely, however, that any comparison between children from different socio-economic backgrounds will merely reflect this. It is known, for example, that many of the circumstances most likely to have an adverse effect upon children's adjustment occur more frequently in homes of lower socio-economic status.
However, in any study of complex variables, the most straightforward relationships have first to be examined so that allowance can be made for these in subsequent analyses. In view of the marked difference between the sexes in adjustment, as assessed by the total score on the Social-Adjustment Guides (see Section VG), it was decided to study the association between adjustment and occupational group separately for boys and girls.
The children were divided for the purpose of this analysis into two groups on the basis of their scores on the Guides: those with a score of 0 to 9 ('stable') and those with a score of 10 or more ('unsettled and maladjusted').
[page 526]
In Tables 77 and 78 the results are given in percentage form for all children in the present sample in any category of school for whom all the appropriate information was available.
Table 77
Social Adjustment and Occupational Group of the Father for BoysN = 3,244
Social
adjustment
scores | Occupational groups | Total |
| 1 | 2 | 3 | 4 | 5 |
'Stable'
(Total score 0-9) | 68.5 | 67.5 | 58.7 | 51.4 | 42.5 | 59.5 |
'Unsettled and maladjusted'
(Total score 10+) | 31.5 | 32.4 | 41.3 | 48.5 | 57.6 | 40.5 |
| TOTAL | 100 | 100 | 100 | 100 | 100 | 100 |
Chi-squared (Trend) = 64.2; p < 0.001
Chi-squared (Departure) = 3.6 (3 d.f.); p > 0.05 not significant
Table 78
Social Adjustment and Occupational Group of the Father for GirlsN = 3,223
Social
adjustment
scores | Occupational groups | Total |
| 1 | 2 | 3 | 4 | 5 |
'Stable'
(Total score 0-9) | 79.4 | 82.7 | 71.3 | 71.4 | 61.8 | 73.7 |
'Unsettled and maladjusted'
(Total score 10+) | 20.6 | 17.3 | 28.7 | 28.6 | 38.1 | 26.3 |
| TOTAL | 100 | 100 | 100 | 100 | 100 | 100 |
Chi-squared (Trend) = 32.8; p < 0.001
Chi-squared (Departure) = 11.6 (3 d.f.); 0.01 > p > 0.001
It will be seen in both tables and in Figure 8 that the proportion of 'stable' children shows a tendency to fall from occupational group 1 to occupational group 5. In both cases the statistical tests are highly significant, indicating that for both boys and girls of this age there is an overall tendency for adjustment in school to be poorer in children from homes of lower socio-economic status.
[page 527]
Figure 8
Social Adjustment and Occupational Group of the Father
N = 6,467
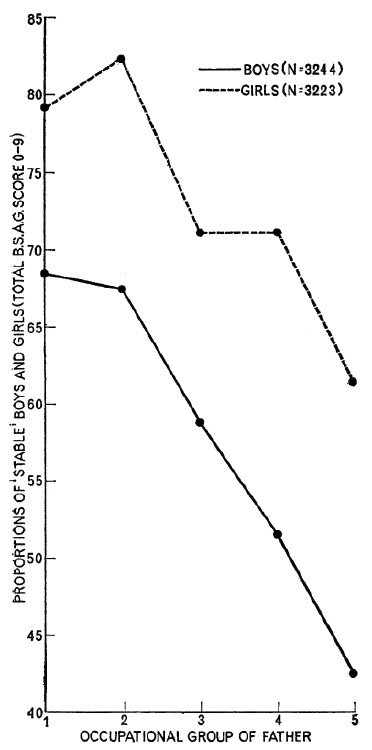
However, there was an interesting difference between the results for the two sexes. In the case of boys of this age there is strong evidence for a decrease in 'stable' behaviour the lower the status of the paternal occupational group and no evidence that this 'decline' is not consistent through the Occupational
[page 528]
Groups. For girls of this age there is the same evidence of a decrease in 'stable' behaviour through the occupational groups, but there is also evidence that the 'drop' from one occupational group to another is not uniform.
It will be seen in Table 78 and Figure 8 that the proportion of 'stable' girls in occupational group 2 in this particular sub-sample was higher than that in occupational group 1. In occupational group 3 the proportion dropped considerably, but there was virtually no difference between the picture there and in occupational group 4. There was then another drop to occupational group 5.
In the absence of further statistical analysis no conclusions can be drawn about the patterns of results in this sub-sample. The fact that there were more 'stable' girls in occupational group 2 than occupational group 1 is unexpected and may be due to chance fluctuations.
What does emerge from the analyses of the total scores from the Bristol Social-Adjustment Guides is, first, that girls at the age of seven are markedly better adjusted in school than boys (see Section VG). Secondly, for both sexes there is a strong tendency for the least well-adjusted children to be in lower socio-economic groups. Thirdly, it appears that for boys the relationship between socio-economic factors and adjustment in school is consistent, whereas for girls the relationship is not uniform and appears to be more complex.
It is highly likely that socio-economic factors, as assessed by the occupational group of the father, are related to children's adjustment in school because these factors are themselves associated with other circumstances in the social and physical environment of the family and neighbourhood; and also with the physical and mental health of the parents. A more detailed analysis of some of these circumstances in relation to children's adjustment is planned.
VII: FIRST FINDINGS: SUMMARY AND DISCUSSION
A. EDUCATIONAL, BEHAVIOURAL AND SOCIAL ASPECTS
1. Introduction
Undoubtedly there were many disadvantages in having to produce an early report, not least of which lay in the need to hedge conclusions around with repeated reminders of the preliminary and incomplete nature of both the sample and the analysis. However, there accrued at least one advantage.
In the past, the delay between the completion of studies, especially large scale ones, and their findings being published has tended to be very long. This enables practitioners and administrators to assert that events may have in the meantime brought about such changes that the need for action had been lessened if not eliminated; or that a new investigation would have to be mounted to take account of changed conditions - thus postponing action. In the case of the National Child Development Study, the interim findings presented in this Report have become available 18 months from the beginning of the project and about 12 months after the data on the children began to be collected. Thus, the information is so recent in origin that even in a period of comparatively rapid social and educational change the findings describe the situation as it actually is at present.
[page 529]
In recent years there has been increasing interest in the complexity of all the influences which affect children's development, and research techniques have grown more subtle, more comprehensive and more rigorous. 'The time has certainly come for some co-operative scheme of research into the innumerable questions that arise. A single investigator can do little, except make a few limited and tentative experiments and sketch what appears to be the most valid methods of inquiry. The teacher, the medical officer, the social worker, the psychologist, the statistician - all need to lend their expert knowledge'. These prophetic words are from Burt's (1937) classic survey which has never been paralleled, in this country or anywhere else. Yet 27 years later, Wiseman (1964), discussing the relationship between environment and educational progress, has to state that 'research is still largely a matter of preliminary survey and exploration, seeking new insights to form the bases of more productive hypotheses. We know very little about the mechanisms underlying the variations of a multitude of environmental factors: with no firm grasp of these, too many research workers attack a small and ill-defined sector of the field, armed with little but a hunch or a prejudice and using whatever variables may come conveniently to hand'.
The National Child Development Study has taken account of both Burt's and Wiseman's strictures: conceived as an inter-disciplinary project, it is sponsored jointly by four bodies; financed by a number of government departments; it depends on the co-operation, indeed active collaboration, of all local authorities in England, Scotland and Wales, which was granted to a most generous extent; and the composition of the research team itself was also multi-disciplinary. Moreover, hypotheses were formulated before any of the material was available for analysis.
The Study has also largely overcome another common difficulty, that of sampling. It is well known that there are strong regional differences because various parts of the country differ widely economically, culturally and socially (Floud, Halsey and Martin, 1957; Derrick, 1961); and one study (Ferrez, 1961) suggests that - at least in France - 'geographical factors are even more important than the social ones'. Fortunately, sufficient financial support was given to this Study to make it possible to follow up the entire cohort. It could, of course, be argued that there may still be some sampling bias since all the children were born in one week in March; they could conceivably have certain characteristics which differentiate them from children born in anyone or all of the remaining 51 weeks of 1958. Whether and to what extent this is the case will have to await the time when the formidable financial and organisational difficulties involved in mounting more than one national perinatal mortality survey in anyone year have been overcome. The fact that inter-disciplinary research is still largely in an early, almost preliminary, phase means that one of the main productive results of large-scale studies such as ours is the posing of questions to form the stimuli for further investigations. In particular, there are two kinds of study which should follow from it: first, surveys comparable in scope and methodology should be mounted every 10 years or so; this would make possible the observation on a national scale of changes in child development in relation to changes in the economic, social, medical and educational sphere. Secondly, such large-scale studies should prepare the way for smaller but much more detailed and intensive inquiries into individual differences in the development of children's
[page 530]
personality, mental and physical growth, health and educational progress. In fact, plans for both these types of investigation have already been prepared (together with financial estimates), and it must now be hoped that the necessary funds will become available.
2. Over-view
This interim report has two aims: the first and main aim was to give as detailed a picture as possible of a large national sample of seven year old boys and girls. This is presented in Section IV: 'Descriptive Statistics'. Of course, data of this kind are normative and no value judgements are made as to what is desirable or undesirable, but attention is focused on what is taking place. When the material for the total sample has been analysed, the picture will then become more reliable and meaningful. The second aim was to make at least a beginning with the much more complex task of unravelling the influence of and relationship between a wide range of factors (including pre- and post-natal conditions) and children's physical and psychological development, educational progress, adjustment and behaviour at home and school. What, then, are the more salient findings thus far?
(a) Settling at School
It would seem that the majority of children settle down within the first month of starting school. However, a sizeable proportion (some 25 per cent) remain unsettled up to three months or longer; there is a very significant difference between the sexes, boys taking longer to settle down than girls. The results indicate that the schools of about one third of the children use some form of introductory attendance prior to the commencement of full-time schooling. Our data do not readily lend themselves to an exploration of the extent to which such schemes have any effect in shortening the subsequent settling down process; but at least theoretically one would expect this to be the case.
(b) Parental Interest
The parents' interest in their children's education and their contact with the school was assessed in three ways: first, teachers' ratings of parental interest; these indicated that parents showing little or no interest are in a minority (some 16 per cent), there being no difference between mothers and fathers in this respect. Secondly, teachers were asked whether during the current school year parents had taken the initiative in discussing their child with a member of the staff; a rather high proportion had not done so (43 per cent); when this question was explored in relation to fathers' occupational group, it was found that the higher the socio-economic status the greater the proportion of parents who had spontaneously sought an opportunity to discuss their child with a member of staff. Thirdly, asked whether they would wish their child to remain at school beyond the minimum school leaving age, the great majority of mothers replied in the affirmative (over 80 per cent).
Of course, these three criteria are not only rather broad and crude but also involve different degrees of subjectivity. But it looks as if the parents of about half the sample showed an active interest and involvement in their child's schooling, while a minority appear to be lacking such interest.
A first exploration of the relationship between one of the indices of parental interest in the child's education and tested attainment in reading showed
[page 531]
there to be a significant association: the proportion of good readers was higher among those children whose parents had themselves initiated some contact with the school, and this was true also for boys and girls separately. Then the relationship was examined between parental interest and reading attainment within each of the five occupational groups separately; the same association was found within occupational groups for boys in occupational groups 1, 3 and 4 and for girls in occupational groups 1 and 3.
(c) Educational Attainment
Even at the early age of seven years, girls were found to be significantly better at reading than boys; this held true whether the yardstick was an objective test or the level of the reading book the child was able to manage or the teacher's judgement of the child's reading ability. When this was examined in relation to socio-economic level - assessed in terms of the occupational group of the children's fathers - there was a highly significant difference in the direction predicted on the evidence of previous studies: the lower the occupational status of the fathers, the poorer the reading attainment of the children.
Though the children in this Study are all the same age, they have experienced varying length of schooling because administrative arrangements for starting school differ in different parts of the country. This provided an opportunity to compare those who had been admitted to infant schools before the age of five ('early starters') with those whose attendance commenced after their fifth birthday ('late starters'). Looking at the reading attainment of these two groups, a significant difference in favour of the 'early starters' was found, even though for the majority the difference in length of schooling had only been one term. This difference between 'early' and 'late' starters was found to be independent of occupational group.
One other environmental variable was explored in relation to reading attainment; namely, whether the child lived with both his natural parents or not, the former being referred to as the 'normal' and the latter as the 'atypical' family situation. The 'atypical' situation included not only 'one-parent' families but also children who had one step-parent or who were adopted, fostered or in residential care. It was found that reading attainment was significantly lower for those whose family situation was 'atypical', and this was equally true for boys and girls. When the same question was examined in relation to socio-economic status, a rather more complex pattern emerged: for the higher occupational groups (1, 2 and 3) the result was the same, namely, reading attainment being higher for children living with both their natural parents; but in occupational groups 4 and 5, the proportion of poor readers did not differ whether the children had a 'normal' or 'atypical' family background.
Now to turn to attainment in arithmetic. Here, boys were found to be superior to girls on a test of problem arithmetic. Again, there was a relationship between attainment in this subject and paternal occupational group; the lower the latter, the lower the children's score on the test. Length of schooling was also significantly associated; higher arithmetic scores were attained by 'early' than 'late' starters. When fathers' socio-economic status was taken into account, the same relationship between starting school 'early' and good arithmetic attainment was found to exist independent of Occupational Group.
[page 532]
The few researches that have considered the differences between reading and arithmetic in their response to environmental effects have produced somewhat conflicting results; some showed that reading is more prone to this than is arithmetic (Thorndike, 1951; Burt, 1955; Davis and Kent, 1955; Lynn, 1958), while others do not find this to be the case (Wiseman, 1952; Kemp, 1955). At this stage there has been no analysis of possible differential effects; the present results do, however, indicate that at the age of seven both reading and arithmetic are related to environmental aspects. Further, an 'early' start in the infant school is associated with higher attainment in both subjects some two years later, irrespective of parental socio-economic status.
Three other, more general abilities were explored by means of teachers' ratings. For both 'oral ability' and 'creativity' girls were rated higher by their teachers than boys, while the position was reversed regarding 'awareness of the world around'. At this stage time did not permit any more detailed examination of these abilities or their relationship to other variables.
(d) Behaviour and Adjustment
These were assessed in two ways: by asking mothers about the behaviour and developmental difficulties of their children; and by obtaining information from teachers by means of the Bristol Social-Adjustment Guides, which were completed for each child. So far, only some preliminary analysis of this material has been possible.
For most aspects of behaviour, there was evidence that a greater proportion of boys, as reported by their mothers, show difficulties at home. However, there are some exceptions; for example, more girls than boys suck their thumb or fingers during the day and bite their nails. The differences between the sexes appeared to be most marked for aggressive types of behaviour. It is worth noting that a sizeable proportion of seven year olds are reported to be faddy over food; and to throw the occasional temper tantrum (a little under 30 per cent in each case). In these two aspects of behaviour there were no significant differences between boys and girls. However, more boys are reluctant to go to school than girls.
Deviations from normal behaviour which many clinicians would consider as likely indications of some degree of emotional disturbance occurred only among a small minority. Thus, between one and eight per cent of children were reported to show the following behaviour frequently: difficulty in settling to anything for more than a few moments; destroying their belongings or those of others; frequently disobeying parents; being upset by new situations; and bodily twitches or mannerisms. In this context it is interesting to recall a recent study by Glueck (1966) dealing with the 'Identification of potential delinquents at 2-3 years of age'. The three behaviour traits which, when manifested at an early age, markedly distinguished later delinquents from non-delinquents were 'extreme restlessness, destructiveness and non-submissiveness to parental authority'. Thus, these traits are considered by Glueck to have high predictive value, not only for distinguishing future delinquents but also for diagnosing maladjusted or 'malfunctioning' children.
When the children's behaviour in school was assessed by means of the Bristol Social-Adjustment Guides, there was again a highly significant difference between the sexes: the proportion of boys being rated as 'maladjusted' was
[page 533]
twice as great as that of the girls; the converse was also true, namely, significantly more girls were being rated as 'stable' than boys. At a later stage qualitative differences in the type of deviant behaviour shown by boys and girls respectively will be explored. However, using the criterion of the Guides, it looks as if about 13 per cent of seven year olds show behaviour indicative of 'maladjustment'.
When adjustment was examined in relation to socio-economic status, it was found that the proportion of 'stable' children decreased the lower the occupational group of the fathers. Though this was the case for both sexes, the 'decline' from one occupational group to the next was uniform for boys but not for girls.
'Social-adjustment' was then examined in relation to length of schooling. A significant difference was found between 'early' and 'late' starters, the latter showing more indications of poor adjustment than the former. This relationship between 'early starting' and better adjustment was also found to hold independent of occupational group.
(e) Need for Special Provision
This term is used here in the widest sense to include facilities within and outside the ordinary school, as well as provision for all kinds of difficulties, be they educational, emotional or physical.
First, to consider backwardness in reading. There is some evidence from our results that there has been a decrease in the proportion of poor readers during the past ten years (Morris, 1959). Nevertheless, a considerable number of children in this sample of seven year olds were described by their teachers as being either non-readers (about three per cent) or poor readers (about 24 per cent). An even larger proportion (almost half the sample) had not achieved a sufficient mastery of this subject near the end of their infant schooling to use it as an effective tool for further learning; rather, reading must continue to be specifically taught, because full mastery of the skill has not yet been attained. Thus, on the evidence of the children's present reading abilities about a quarter will need a continuation of 'infant methods' if they are to progress with this basic subject; moreover, a proportion of them will probably be unable to succeed unless given general educational help of one kind or another, not merely help with reading.
To ascertain the likely size of this group, teachers were asked two questions: how many of the children were at present receiving special help because of educational or mental backwardness and how many would benefit from such help if it were available. The answer to the first question was five per cent and to the second question eight per cent; in each case the proportion of boys being significantly greater than that of the girls. Thus, in the teachers' judgement some 13 per cent of the children would derive benefit from educational help additional to what could be provided by class teachers themselves.
With regard to special educational help, including special schooling, teachers were of the opinion that within the next two years this would be a likely requirement for some five per cent; this was in addition to the half per cent already attending special schools. However, for a number of reasons, this figure of five per cent is likely to be an underestimate.
One other direct method was used to arrive at some estimate of the need for special provision; this was by finding out from teachers how many children
[page 534]
had been referred to outside agencies because of behaviour difficulties or lack of progress. The figure reported, 9.5 per cent, is again likely to be an underestimate: some children will have been referred to an outside agency unbeknown to their teachers; and, perhaps much more important, a lack of diagnostic and treatment facilities has a curtailing effect on the number of referrals. Such a lack exists in many areas with a consequent shortage of places in special schools and long waiting lists for an examination in school psychological services and child guidance clinics, where these exist. Conversely, it is a well-known phenomenon that if a new special school or child guidance clinic is opened, there is a steep rise in the number of referrals. Lastly, there is one indirect way of trying to assess the need for psychological consultation and possibly treatment. The extent of the developmental and behaviour difficulties reported by the mothers and the proportion of children assessed on the Social-Adjustment Guides to be 'maladjusted' at school would indicate that a minimum of five per cent have quite serious adjustment problems, while at least a further 10 per cent show stress symptoms of various kinds.
Only further analysis will provide evidence on the degree of overlap between educational and emotional problems as well as on their relation to the whole range of physical handicaps. What seems already beyond doubt is the fact that there is a need for special provision during the second year in the infant school if educational and emotional problems are to be dealt with as soon as they are recognised by teachers and parents.
3. Some Pointers to Policy and Practice
Starting school presents for most children a major step forward in independence, but also a major departure from their previous pattern of life. Might not a more widespread adoption by infant schools of the practice of 'introductory attendance' both ease and speed up the process of settling down? It is now widely recognised that parental interest in the child's education plays a vital part in satisfactory progress. Are not infant schools the most natural and logical starting point for fostering such interest on a much wider scale? This would involve giving some priority to them in terms of staff and money. Perhaps increasing responsibility for enlisting parental interest should also be undertaken by school welfare officers and health visitors? Or should teachers who have taken one of the newly established courses for joint social work/teacher training be encouraged to work in infant schools? Could voluntary workers include in their service to the community the task of freeing parents of large families to visit their children's school by looking after those who remain at home?
'Early starters' have higher attainment and better adjustment than children who start school about a term later. Perhaps this advantage is comparatively short-term; only subsequent examinations of the same children will tell. But if the advantages turn out to be long-term, should attempts be made to ensure an earlier start, especially for the culturally and socially underprivileged? Low socio-economic status is associated, even by the age of seven, with low educational attainment and high 'maladjustment'. If equal educational opportunity is to become a reality, ought not pre-school education, specially geared to the needs of culturally deprived children, to be given high priority?
[page 535]
The well-known pattern of boys being more backward in reading and showing a higher incidence of behaviour difficulties was found to exist already by the age of seven years. Is there a continuum of vulnerability stretching right back to prenatal and perinatal days? If later work does establish such a link, would boys' greater vulnerability indicate a need for differential child-rearing and educational practices? Or is their relatively inferior performance a result of current child-rearing and educational practices? For example, could it be related to the fact that it is largely women who care for and educate boys during the early years? Would more male teachers in infant schools have a beneficial result on boys' educational progress and adjustment?
About 45 per cent of children appear not to reach full mastery of reading skills by the time they are due to leave infant schools. This means that the teaching of reading needs to be continued at the junior level; also there should be some continuity in teaching methods and reading schemes. This clearly has implications for both policy and practice. Is the present age of transfer the most appropriate? Must there be a uniform transfer age? Is there effective practical recognition, both in teacher training and in appointing junior school staff, of the need for infant school reading methods beyond the age of seven?
The proportion of educationally backward and emotionally maladjusted children appears to be high enough by the second year in the infant school to warrant greatly increased provision for their needs. Such early provision, including diagnosis and treatment of various kinds, would be in line with the increasing emphasis which is being placed on early detection and prevention. The focus of such early preventive work should be on socially and culturally underprivileged children, especially boys, since by the age of seven their needs are clearly the greatest, at least numerically. Hitherto, a much greater proportion of children from the higher socio-economic groups find their way into child guidance clinics, while a much higher proportion of boys from the lower socio-economic groups eventually appear in juvenile courts. Of course, poverty, broken or disrupted family life, housing difficulties, especially of large families, all contribute to this pattern of backwardness and maladjustment. At the same time, early remedial and psychological treatment has much to offer, particularly if it could be part of a more comprehensive scheme for family-centred, preventive and rehabilitative work. What kind of diagnostic and treatment centres would be most appropriate for dealing with those in greatest need? How can parental co-operation be obtained? And is it essential? What should be the relationship between preventive social, educational and psychological services? Need there be better integration of policies, services and practices?
References
BURT Sir C The Backward Child (University of London Press) (1937).
BURT Sir C 'The evidence for the concept of intelligence'. Brit. J. Educ. Psychol., 25, pp. 158-77 (1955).
DAVIS DR and KENT N 'Intellectual development in school children, with special reference to family background'. Proc. Roy. Soc. Med. 48, pp. 993-5 (1955).
DOUGLAS JWB The Home and the School (MacGibbon and Kee) (1964).
[page 536]
FERREZ J 'Regional inequalities in educational opportunity'. In HALSEY AH (Ed.) Ability and Educational Opportunity, Organisation for Economic Co-operation and Development (1961).
FLOUD JE, HALSEY AH and MARTIN FM Social Class and Educational Opportunity (London: Heinemann) (1957).
FRASER ED Home Environment and the School (University of London Press) (1959).
GLUECK ET 'Identification of potential delinquents at 2-3 years of age'. International J. Soc. Psychiatry, 12, pp. 5-16 (1966).
KEMP LCD 'Environment and other characteristics determining attainments in primary schools'. Brit. J. Educ. Psychol., 25, pp. 67-77 (1955).
LYNN R 'Disparity of attainment in reading and arithmetic'. Brit. J. Educ. Psychol., 28, pp. 277-80 (1958).
MORRIS JM Reading in the Primary School (National Foundation for Educational Research) (1959).
THORNDIKE RL 'Community variables as predictors of intelligence and academic achievement'. J. Educ. Psychol., 42, pp. 321-38 (1951).
WISEMAN S Education and Environment (Manchester University Press) (1964).
B. PHYSICAL AND MEDICAL ASPECTS
1. Scope and Value of the Preliminary Analysis
New methods of surveillance and investigation of school children's health should be constantly evolving. Easier adaptation to changing circumstances occurs where a large national cohort is used to monitor the proportion of children requiring treatment for physical ill-health. Where this reveals previously undetected or untreated cases, action is indicated - either towards prevention through health education or towards earlier diagnosis of major and minor handicaps by more screening tests and increased surveillance from infancy onwards.
Follow-up of such a national group of children throughout their childhood can also throw some light upon new ways of establishing an optimum procedure for assessing health and growth. As no interim study of the children had been undertaken since birth, the seven year old follow-up included a detailed developmental and medical history as well as a full physical and medical examination. This must not, of course, be taken to imply that a complete medical history and examination is felt to be ideal, or even practicable, as a routine procedure for British school children at seven years of age. Procedures at this age might include selective screening tests; a questionnaire or personal enquiry of parents and teachers; or a medical examination of vulnerable groups. Emphasis on high-risk children is typical of a growing number of school health services.
The present preliminary results also indicate a need for increased medical staff trained in child development; closer contact between parents and educational and school health services; more screening procedures; and added efficiency in early diagnostic procedures to 'identify' major and minor handicaps in pre-school and infant school children.
Pre-school records of the present sample show that only in infancy was observation optimal for early diagnosis. Over 80 per cent had attended infant welfare clinics. Between one and five years considerably fewer (38 per cent)
[page 537]
had been taken to a pre-school or toddler clinic; an unknown number would have been seen by their general practitioner.
No attempt has been made on this incomplete sample to examine the nature of previously undiagnosed disabilities. At a later stage it is hoped to investigate these cases as well as the age at diagnosis of known handicaps and the educational and medical facilities provided. However, it is doubtful whether even a follow-up of more than 15,000 children will yield a sufficient number of major handicaps to evaluate the efficacy of 'treatment' for separate conditions. Interest in the handicapped children will centre mainly on their perinatal correlates.
The present Report covers mainly the field of minor disabilities and deviations and the assessment and testing of special senses. In many spheres the results may be seen as an adjunct to the statistics assembled in the reports of local authority school health services and summarised in the biennial reports of the Chief Medical Officer of the Department of Education and Science. The results are more valuable where national figures are otherwise unavailable and also where gross regional or local variations in reported incidences indicate ambiguities of definition or interpretation.
The present Report, thought to be regarded as provisional, does demonstrate the feasibility of gathering national data on the health of children through the school health services. By using a standard format and modern data-processing techniques, it has been possible to present interim results in a very short period.
The pre-coded answers both for the history obtained from the mother and for the medical examination covered relevant aspects of every system which could readily be reproduced. The medical examinations were carried out without special apparatus or conditions by school medical officers. The information gathered was more comprehensive than would normally be considered necessary or possible at routine examinations, but regular shortened inquiries, pre-coded and rapidly data-processed, would allow decisions to be taken from a consideration of results while still current. The present Study, then, may in part be of value as a pilot for a national system of recording and retrieving data on the health of school children.
2. Descriptive Statistics
Information was obtained on past development and illnesses. This was retrospective as the children were not followed between birth and seven years. For this Report careful selection was made in view of its potential unreliability. Most of such data are used only in sex comparisons. However the retrospective data were gathered very much as any routine medical history. Data in Appendix 1* allow the reader to calculate past incidences if he wishes. He may be surprised at the reported frequency of certain conditions of which a history is often considered abnormal. One such condition is nocturnal enuresis; about one in nine of the children were reported as being wet by night more than occasionally between five and seven years. A much smaller proportion (4.4 per cent) had daytime incontinence after three years and only 1.2 per cent were reported to have soiled by day after four years.
Much is written currently on the ill-effect of periods of separation due to hospital admission and the present policy is moving towards unrestricted visiting of children in hospital. The wide importance of this subject is shown
* Not included in this version.
[page 538]
by the high proportion of children who had been admitted to hospital by seven years of age for various conditions. Any effect on social adjustment will be investigated later. Strikingly high among causes for admission were accidents and other injuries both at home and elsewhere. This underlines the need for better education in accident prevention.
Sex differences in Section VE ('Medical and Developmental Sex Comparisons') confirm for many morbidity factors what is already known for perinatal, infant and childhood mortality, namely the greater vulnerability of boys. For example, boys attended more often at child guidance clinics and speech clinics and showed more facial tics, stammers and other speech defects, as well as being more accident-prone and, historically, later in developmental 'milestones', including walking, talking and bladder control.
Disorders of special function such as hearing, vision and speech are among the most important educational considerations at the age of seven. Section VC, therefore, summarises the results of investigations into these functions. The extent to which defects of hearing and speech had impinged upon parental consciousness was indicated by a past history of hearing difficulty in 10 per cent and some speech abnormality in 16 per cent. The workload carried by the corresponding medical services was considerable, though it could only be estimated retrospectively. Apart from school visual or auditory tests, 12 per cent of mothers reported that the children had attended for special visual examination and eight per cent at hearing or audiology clinics.
The strain placed upon the childhood dental services was underlined by the fact that three quarters of the children were reported as having already come under the school or general dental services by seven years of age. Many would feel, however, that all children should have dental assessment, and the importance of this is emphasised by the fact that one in five were found on examination to have a minimum of eight or more decayed, missing or filled teeth.
Minor visual impairment was also reported to be quite frequent. Approximately one in seven of the children were assessed by the medical examiners to have a visual defect, but only 0.3 per cent were judged as handicapped for normal schooling and everyday activities; some six per cent of the sample were found on examination to have a squint (manifest or latent); over five per cent had uncorrected visual acuity of 6/12th or less in the right eye, and a similar proportion in the left eye. And what of treatment? Six per cent of children wore or had already required glasses, 25 per cent of whom had corrected vision of 6/12th or less in one or other eye. Should more children be regarded as potentially visually handicapped and put near the front of the class?
About five per cent of seven year olds were judged by the medical examiners to have a minor degree of hearing impairment. Analysis of the clinical hearing test of these children and of their audiograms should throw further light upon this.
Speech difficulties clearly gave concern to parents. One in six of the children were reported as having had current or past stammer or stutter (6.2 per cent), or other speech difficulty (10 per cent). Over two per cent had received speech therapy by the age of seven. A stammer or stutter was observed on examination in about one per cent. In a rating of the children's speech intelligibility by the medical examiners, about 14 per cent were judged to be not fully
[page 539]
intelligible, but only 1.4 per cent were assessed as having a moderate or severe impairment of speech.
At the present stage, time has permitted the analysis and presentation of only a part of the medical information which has been gathered. In addition, some results have been withheld until data on the 'late returns' can be processed because of particular danger of bias or misleading conclusions. In a later report it is intended not only to fill these gaps but also to examine the correlations between current medical, physical, educational, psychological and social factors and also, of course, to utilise the very comprehensive perinatal data in an investigation of the relationship between factors at or before birth and subsequent health and development.
[page 540]
THE TABLES
For reasons of space, most of the tables and all of the questionnaires appearing in the text of the main Report have been omitted in this version. The tables reprinted here are:
A1 SOUTHGATE READING TEST SCORES
A2 PROBLEM ARITHMETIC TEST SCORES
A3 TEACHERS' RATINGS OF READING ABILITY
A33 PAST HISTORY OF SPECIALIST CLINICS AND SERVICES
A40 ASSESSMENT OF SPEECH INTELLIGIBILITY
[page 541]
Table A1
Southgate Reading Test Scores
Reading
scores | N | Per cent |
| 0-3 | 69 | 0.7 |
| 4-6 | 211 | 2.0 |
| 7-9 | 462 | 4.4 |
| 10-12 | 546 | 5.2 |
| 13-15 | 624 | 5.9 |
| 16-18 | 690 | 6.6 |
| 19-21 | 874 | 8.3 |
| 22-24 | 1,118 | 10.7 |
| 25-27 | 1,761 | 16.8 |
| 28-30 | 4,133 | 39.4 |
| Total tested | 10,488 | 100 |
| No data | 108 | |
| GRAND TOTAL | 10,596 | |
Table A2
Problem Arithmetic Test Scores
Arithmetic
scores | N | Per cent |
| 0 | 230 | 2.2 |
| 1 | 486 | 4.6 |
| 2 | 998 | 9.5 |
| 3 | 1,317 | 12.6 |
| 4 | 1,480 | 14.1 |
| 5 | 1,493 | 14.2 |
| 6 | 1,375 | 13.1 |
| 7 | 1,153 | 11.0 |
| 8 | 919 | 8.8 |
| 9 | 641 | 6.1 |
| 10 | 388 | 3.7 |
| Total tested | 10,480 | 100 |
| No data | 116 | |
| GRAND TOTAL | 10,596 | |
[page 542]
Table A3
Teachers' Ratings of Reading Ability
| Descriptions of ratings | N | Per cent |
| Avid reader. Reads fluently and widely in relation to his age | 710 | 6.6 |
| Above average ability. Comprehends weIl what he reads | 2,569 | 23.8 |
| Average reader | 4,685 | 43.3 |
| Poor reader. Limited comprehension | 2,539 | 23.5 |
| Non-reader, or recognises very few words | 305 | 2.8 |
| Total tested | 10,808 | 100 |
| No data | 25 | |
| GRAND TOTAL | 10,833 | |
Table A33
Past History of Specialist Clinics and ServicesNumber of boys = 4,059; Number of girls = 3,926; Total = 7,985
| Attendance | Total | Don't
know | No
data | Incidence
per cent |
| Yes | No |
(a) Eye department or clinic,
optician or orthoptist | Boys | 534 | 3,500 | 4,034 | 18 | 7 | 13.2 |
| Girls | 473 | 3,429 | 3,902 | 19 | 5 | 12.1 |
| Sex difference: Chi-squared = 2.2 (1 d.f.); p > 0.05 not significant |
| (b) Hearing or audiology | Boys | 327 | 3,696 | 4,023 | 27 | 9 | 8.1 |
| Girls | 305 | 3,590 | 3,895 | 26 | 5 | 7.8 |
| Sex difference: Chi-squared = 0.2 (1 d.f.); p > 0.05 not significant |
| (c) Dental services | Boys | 3,062 | 975 | 4,037 | 12 | 10 | 75.8 |
| Girls | 2,986 | 905 | 3,891 | 17 | 18 | 76.7 |
| Sex difference: Chi-squared = 0.9 (1 d.f.); p > 0.05 not significant |
(d) Physiotherapy or
remedial exercises | Boys | 166 | 3,868 | 4,034 | 21 | 4 | 4.1 |
| Girls | 152 | 3,750 | 3,902 | 20 | 4 | 3.9 |
| Sex difference: chi-squared = 0.2 (1 d.f.); p > 0.05 not significant |
| (e) Child guidance clinics | Boys | 48 | 3,987 | 4,035 | 20 | 4 | 1.2 |
| Girls | 15 | 3,891 | 3,906 | 19 | 1 | 0.4 |
| Sex difference: Chi-squared = 16.4 (1 d.f.); p < 0.001 |
| (f) Speech therapy | Boys | 120 | 3,913 | 4,033 | 21 | 5 | 3.0 |
| Girls | 52 | 3,853 | 3,905 | 19 | 2 | 1.3 |
| Sex difference: Chi-squared = 25.3 (1 d.f.); p < 0.001 |
[page 543]
Table A40
Assessment of Speech Intelligibility
Number of boys = 4,053; Number of girls = 3,917; Total = 7,970
| Boys | Girls | Total |
| Speech fully intelligible | 3,361 | 3,433 | 6,794 |
| Almost all words are intelligible | 581 | 406 | 987 |
| Many words are unintelligible | 66 | 34 | 100 |
| All or almost all words are unintelligible | 10 | 4 | 14 |
| Don't know or unable to test | 33 | 38 | 71 |
| No data | 2 | 2 | 4 |
[page 544]
APPENDIX 11
THE ORGANISATION OF JUNIOR SCHOOLS AND
EFFECTS OF STREAMING:
NATIONAL FOUNDATION FOR EDUCATIONAL RESEARCH:
A PRELIMINARY REPORT
This Appendix is an abridged version of the two reports submitted to the Council by the National Foundation for Educational Research. A fuller version was published in November 1966 as part of a Supplement to Educational Research. The reports were written by Mrs Joan Barker Lunn, assisted by CJ Tuppen and Mrs J Bouri.
The research project on which the material is based was commissioned by the Department of Education and Science in the expectation that its preliminary findings would be of help to the Central Advisory Councils. We are grateful to the Department for this foresight as well as to the Foundation who have so helpfully provided preliminary reports in advance of their own publication. The present report relates to children in different years of junior courses. The Foundation are following up those children who were at the beginning of the junior course when the study was made and this will continue until they are in their final year of the junior school. The whole report will probably be published at the end of 1968.
[page 545]
PART I
Junior Schools and their Type of Organisation
INTRODUCTION
The National Foundation for Educational Research was asked by the Department of Education and Science to investigate the effects of 'streaming' and 'non-streaming' in junior schools.
The inquiry involved three main parts. Firstly, a general survey of current practices was conducted; secondly, a study of 100 junior schools (50 streamed and 50 unstreamed) was undertaken, to enable some assessment to be made of the effects of 'streaming' and 'non-streaming' on the intellectual and social development of pupils; and, finally, a more intensive study was made of 10 schools to supplement the evidence yielded by the larger scale investigations.
The survey of general practices, which is discussed in the present report, had two aims. The first was to discover the incidence of streaming and the methods of organisation practised in junior schools; the second was to obtain the information required to select a suitable sample of schools for the second stage of the study.
A fact-finding questionnaire was constructed to obtain information about the ways in which classes are formed; the criteria used in deciding the correct stream for each child; and the opportunities for transfer between streams. Questions were also asked about the general circumstances of the school and its pupils, e.g. number of teachers and classrooms, parental occupations, etc. In the early summer of 1963, the questionnaires were sent to a stratified random sample of 2,290 primary schools in England and Wales, and the heads in each of these schools were asked to complete them.
The sample was selected from the population of all primary schools in England and Wales, with the exception of schools which had less than 26 pupils on the school roll. The latter were omitted because the survey was concerned mainly with larger schools in which each year group had to be divided into a number of classes. All local education authorities except one agreed to cooperate. The sample was stratified by type of school and by number of pupils on the school roll. There were six categories for type of school: junior urban; junior rural; junior and infant urban; junior and infant rural; all-age urban; all-age rural; and four categories for school roll number.
Different sampling fractions were used for the different types of school and size categories (see details of the sample in Annex 1), and the sample was drawn from the lists made available by the Department of Education and Science.
One thousand eight hundred and sixty-nine schools returned a completed questionnaire, an overall completion rate of 82 per cent.
Of the 18 per cent that failed to return the questionnaires some schools had closed or had become infants' schools. In others, staff illness, or a recent change in staff, or reconstruction work in progress made it impossible for the questionnaires to be completed. It would therefore seem justifiable to assume that the sample returns were adequately representative, and they have been weighted according to the total junior school population (see Annex 1 for details).
[page 546]
In addition to the stratified random sample discussed above, a special sample of non-streamed schools was obtained by asking all local authorities for lists of their non-streamed junior schools or departments. These were supplied by the majority, and a sample of 50 non-streamed schools was selected, in addition to those which had occurred by chance in the random sample. The 50 schools completed a questionnaire.
These additional schools were not included in the analysis of the random sample but were analysed separately in cases where it was felt that the results obtained from the rather small non-streamed random sample required confirmation. In these instances, reference has been made to the 'special LEA Sample'.
All-age schools were included in the random sample but since the number of these is steadily diminishing and the total number of returns was only 113, they were discarded.
The discussion of the results relates to the situation in junior and junior mixed with infants' schools in 1963. Throughout the Report, the percentages in the tables are based on the weighted sample returns and are representative of the junior school population. The actual number of schools supplying information is also shown in each table (for details of the sample see Annex 1).
[page 547]
1. TYPES OF JUNIOR SCHOOL ORGANISATION
1.0 Introduction
Many schools, both large and small, are faced with the problem of finding an appropriate method of grouping their pupils into classes. In large schools, the number of pupils in each age intake is high. The intake has to be divided into several classes, and a decision has to be made as to what should be the basis or criteria for their formation. Sometimes children of one year group are allocated to classes according to their performance in standardised or school-made tests and/or the teachers' judgements, the more able pupils to the upper streams and the less able to lower streams. Less frequently, the children of one year group are assigned at random to different classes. In small schools, the problem may be how best to divide the pupils into classes, when the number of available teachers or classrooms is fewer than the number of year groups. A common method of coping with this problem is to divide the children according to age, with, in certain instances, allowance for some subsequent demotion or promotion according to ability.
One of the aims of this study was to categorise the methods used for allocating junior pupils to classes. The method adopted by a school in this respect has been designated in this Report as - the type of junior school organisation.
The different types of organisation found in junior schools or departments present a pattern so varied and complex that no simple classification would be adequate; and indeed, only those schools which follow a consistent pattern throughout the year groups in the formation of their classes can be categorised at all satisfactorily.
The type of junior school organisation chosen would seem to depend upon two major factors. The first of these is the number of classes in the school, itself largely determined by the number of pupils and of available staff. The second factor is what might loosely be called the head's social and educational philosophy which is likely to express itself in his attitudes to homogeneous or heterogeneous grouping.
1.1 Number of Classes and Type of Organisation
The forms that homogeneous or heterogeneous ability grouping can take depend upon the number of classes and the number of children on roll. For this reason the schools have been divided into three main sizes representing various degrees of limitation on the possible forms of organisation. This has been done in the following way:
1. Large Schools Those with two or more classes within each year group of pupils. For example a junior school taking pupils over the four year span 7-11 is classified as large if it has eight or more classes. These schools are large enough to stream consistently if they wish to do so.
2. Middle-sized Schools Those with more classes than year groups but fewer than twice as many. An example would be a four year junior school with five, six, or seven classes. Some streaming is possible in these circumstances but not throughout the school.
3. Small Schools Those in which the number of classes is equal to fewer than the number of year groups in the school.
1.2 The Social and Educational Views of the Head
The educational or social philosophies of heads are not easy to determine or to classify. Nevertheless two contrasting tendencies can be distinguished. If a head thinks that he can best allow for individual differences among his pupils
[page 548]
and facilitate teaching by grouping children of like ability or attainment together, he tends to form classes on the basis of the results of a general ability test or some measure of attainment in reading and/or arithmetic. If on the other hand he believes that such practices are educationally harmful, he will assign children to classes by some other, possibly random, procedure.
Some heads do not pursue a consistent policy in this respect. For example in some of the larger schools the youngest two or three year groups were unstreamed and the fourth year streamed. The reasons for adopting this mixed type of organisation are not explicitly stated. It may be that some heads believe that an arrangement that is suitable for one age group is not necessarily so for another. Alternatively, a head who favours non-streaming may feel constrained, because of the number of pupils involved or as a result of outside pressures or the demands of the eleven plus examination, to introduce streaming into the fourth year.
1.3 The Main Types of Organisation
Five main types of organisation can be distinguished, and these are listed below. A sixth, miscellaneous, category has been added and in this group are included those schools which were inconsistent in their methods of grouping. The seventh category is the one-class junior school, which has, of course, no choice in this respect.
Type 1. Homogeneous Streaming
This form of ability grouping is found only in large schools. The children are assigned to classes within each year group, on the basis of ability and/or attainment. Thus the most able pupils are placed in the top (usually the A) stream, the less able are assigned to other streams.
Type 2. Non-Streaming
This is a form of heterogeneous ability grouping, occurring only in large schools and found in two forms:
(a) Parallel Classes
Within the year group, the children are divided into classes each containing pupils from all ability levels. For example, pupils of similar ability are matched and then divided equally into parallel classes, thus giving within each class a complete cross-section of the ability range. Or, more rarely, children are allocated to classes within the year group according to the initial letter of the surname, leading to effective randomisation of ability within each class.
(b) According to Age
The children are divided, within each year group, according to their age, thus producing classes having a narrow age range but a complete cross-section of ability. This form of grouping has been categorised as Type 4 in all schools except large schools, where it is, in effect, a type of 'non-streaming'.
Type 3. Vertical Streaming
This is a form of homogeneous ability grouping across year groups, found mainly in middle-sized schools. The most common method is to have a class for the bright children of one year group, and another for the duller children of two year groups. Alternatively all classes may be drawn from two year groups; for example, the brightest nine and ten year olds may be allocated to one class, and the remainder to another. Other combinations are also possible. This type of organisation results in classes with a wide age range but which are more or less homogeneous in terms of ability.
[page 549]
Type 4. According to Age
This type of organisation, found in middle-sized and small schools, is a form of heterogeneous ability grouping. It involves pupils being assigned to classes on the basis of age, without reference to their attainment or ability.
Type 5. 'Traditional Standard'
This form of homogeneous ability grouping is found mostly in small schools and seems to be a partial survival of the old system of 'standards'. It usually involves the retention or accelerated promotion of a number of pupils each year and its effect is to produce a wide age range but a more or less homogeneous level of attainment within classes.
Type 6. Other Methods (Miscellaneous)
These, found in large, middle-sized and small schools, are for the most part combinations and variations of the methods already described, although some schools use other criteria (e.g. sex, Welsh language) for grouping pupils. This category includes both homogeneous and heterogeneous ability grouping.
Type 7. One Class Junior Schools
The relationship between the type of junior school organisation chosen and the number of classes in the school is illustrated in Table I.
Table I
Relationship between type of school organisation and number of junior classes
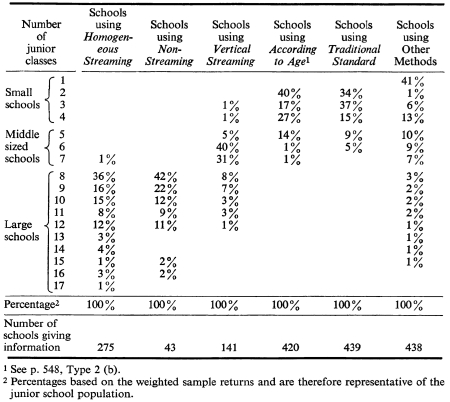 [click on the image for a larger version]
[page 550]
1.4 The number of junior pupils involved in and the proportion of schools using each type of organisation
Table II below shows the approximate number of junior pupils affected by each type of organisation and the percentage of schools using each. From these figures it will be seen that a junior school pupil in 1963 was much more likely to be in a school using a form of homogeneous rather than heterogeneous ability grouping - in fact at least 56 per cent (1) of all pupils were in schools using homogeneous ability grouping.
Table II
The approximate number of junior pupils involved in and the proportion of schools using each type of organisationNumber of schools giving information = 1,756
| Approx. %
of junior pupils
involved | Approx. %
of junior
departments
of schools
using method |
Homogeneous
ability
grouping | Type 1 Homogeneous streaming | 31 | 14 |
| Type 3 Vertical streaming | 11 | 7 |
| Type 5 Traditional standard | 14 | 24 |
Heterogeneous
ability | Type 2 Non-streaming | 5 | 2 |
| Type 4 According to age | 16 | 25 |
| Type 6 Other methods | 21 | 16 |
| Type 7 One junior class only | 2 | 12 |
| | 100 | 100 |
Number of schools giving information = 1,756
SUMMARY OF MAIN CONCLUSIONS
The following provides a summary of the main findings of each section of Part I; for a full discussion see NFER publication New Research in Education, November 1966.
2. LARGE SCHOOLS AND THEIR TYPE OF ORGANISATION
1. In large schools (i.e. eight or more classes) the predominant type of organisation was Homogeneous Streaming - used by 65 per cent of large schools. Six per cent of large schools only were entirely unstreamed, and five per cent were unstreamed except for one year group. Four per cent kept the two younger year groups unstreamed but used Homogeneous Streaming in the two older year groups. Twenty per cent of large schools used other mixed methods.
2. The average size of classes in all large schools was equal, namely 36 pupils. However, class sizes in schools using Homogeneous Streaming were more varied than those in non-streamed schools. Higher ability streams tended to have more pupils than lower ability streams, whereas all classes in non-streamed schools had approximately the same number of pupils.
(1) The figure is probably nearer 70 per cent since many children in schools classified under Type 6 were in fact in homogeneous groups.
[page 551]
3. There were proportionally more girls than boys in the higher ability streams and conversely more boys than girls in the lower ability streams.
4. There was a difference in the average ages of A, B and C streams in all year groups. The A streams had the highest average age and the lowest ability streams were the youngest.
The most important findings are points three and four above. These indicate that the practice of Homogeneous Streaming may penalise boys and younger children of a year group.
Some of the disadvantages of being a 'younger' child in a school year group might be removed if all children were allowed to start school at the same point in the year, thus removing the advantage of longer schooling, which the 'older' child now has. It seems logical for children to start school together at the beginning of the school year, since at every stage of the education system children born within a school year are treated as a group (e.g. they move up the school together, take 11-plus at the same time, etc.).
3. METHODS OF ALLOCATION TO 'STREAMS' AND CLASSES IN LARGE SCHOOLS AND THE PUPIL'S CHANCES OF TRANSFER
1. Schools using homogeneous ability grouping commonly assigned children to classes in their first year at junior school on the basis of their infant school record. After the first year, an internal examination became the most common criterion.
2. Schools using Non-Streaming paid more attention to age and relatively little to infant school record as a criterion for assigning children to classes.
3. After the initial assignment to a class or stream in the first year of the junior school, the chances of a pupil being transferred are very slight.
Taking the school year 1961-62 as a typical year, it appears that movement between streams was relatively small. Once children had been assigned to their streams at seven plus, most of them would remain in the same stream throughout the four years of the junior school. Against this we should put Vernon's estimate, based on the known correlations of the measures used, that about 10 per cent of all children should be upgraded or downgraded each year if relative homogeneity is to be preserved.
Thus reliability and validity of the methods used for grading children to A, B or C streams when they first enter the junior school appear to be of the utmost importance; it is surprising to find that so many junior schools graded their pupils without the help of standardised tests and without making allowance for age.
Since the same largely unscientific criteria as are used to grade the children initially are also used to assess whether second, third or fourth year children should be regraded, it is hardly likely that grading errors will be recognised and rectified at these later stages. Lack of transfers could, of course, be due to an accurate assessment at seven plus, or could be a result of a self-fulfilling prophecy in that membership of a stream tends to condition learning.
4. MIDDLE-SIZED SCHOOLS AND THEIR TYPE OF ORGANISATION
1. The major type of organisation in middle-sized schools (five, six or seven junior classes) was vertical streaming (28 per cent). Thirty-six per cent used Other Methods, 19 per cent According to Age, and 17 per cent Traditional Standard.
[page 552]
2. Thirty-eight per cent of the classes in schools using Vertical Streaming were composed of children from two or more year groups. These classes tended to consist of average and slow pupils, while brighter pupils were more often in classes of one year group only. Vertical Streaming was found mainly in six and seven class schools.
3. In schools grouping According to Age, 70 per cent of classes were composed of one year group only, while 30 per cent had two or more year groups. According to age was found mainly in five class schools, and nearly half of these had a remedial class, thus leaving one class each for the four year groups.
4. Traditional Standard method was found mainly in five and six class schools.
5. The average number of pupils in the class in middle-sized schools was 34.5 although the actual numbers in any class varied more than in large schools; there was little difference in class size between the various types of organisation.
5. SMALL SCHOOLS AND THEIR TYPES OF ORGANISATIONS
1. It was found that the major types of organisation in small schools (four classes or less) were Traditional Standard method (used by 35 per cent) and grouping According to Age (also used by 35 per cent).
2. In schools using the Traditional Standard method, the most frequent type of class was that composed mainly of average children but with a few bright younger pupils who had been promoted. Next most frequent were classes in which a few slow pupils had been 'kept down'.
3. Very often small schools were forced to form classes of more than one year group either because of unequal numbers in the different year groups or through having to allocate four year groups into three classes. The head teacher may, in such circumstances, form classes on the basis of the Traditional Standard method, or he may group According to Age.
4. Seventy-six per cent of classes in small schools were composed of two or more year groups.
5. Some head teachers used the Traditional Standard method - i.e. kept slow pupils down and promoted bright pupils - when they were not forced by circumstances to mix year groups.
6. The average number of pupils in the class was 28 in schools using Traditional Standard and 29 in those grouping According to Age.
6. INTRA AND INTER-CLASS GROUPING
A Intra-class grouping
1. Class teaching (30 per cent of all classes) was used less frequently than group teaching for the 3Rs. The least common intra-class practice was for children to remain in the same group for reading, mathematics and English (nine per cent of all classes).
2. There was a tendency for more attainment grouping in schools using heterogeneous ability grouping (i.e. schools using Non-Streaming or According to Age).
3. Some schools appeared to teach the class as a whole and there was no grouping for the 3Rs even though the class was heterogeneous with respect to ability (28 per cent using Non-Streaming, 22 per cent in middle-sized schools grouping According to Age). This may include schools using individual teaching methods.
[page 553]
4. Some classes were divided into sub-classes on the basis of attainment/ability and pupils were taught the 3Rs in these groups.
5. The smaller the school, the more use made of group rather than class teaching.
6. Grouping was used equally frequently for reading and mathematics, but less frequently for English.
B Inter-class grouping
1. Setting between classes was extremely rare. Four per cent of all schools 'set' for English and six per cent for both mathematics and reading.
2. Twenty-one per cent of schools using Non-Streaming, 47 per cent of middle-sized schools using According to Age and 27 per cent using Traditional Standard had a remedial class.
3. The most common form of remedial group in large schools was the one which met irregularly or for part only of the school day.
4. Remedial help of any kind was much rarer in smaller than large schools.
5. A high percentage of large (81 per cent) and middle-sized schools (53 per cent) segregated their slower pupils in a special class. One in five of schools using Non-Streaming and a half of those grouping According to Age (middle-sized schools) formed remedial classes, even though they did not separate their other ability levels.
6. Slower pupils in small schools were not segregated, although some were 'kept down' with a class of younger pupils (35 per cent of small schools used this method).
7. NEW TRENDS IN JUNIOR SCHOOL ORGANISATION
1. The major types of organisation being introduced in junior schools were non-streaming (19 per cent), grouping by age (12 per cent), group teaching (15 per cent), and individual teaching (10 per cent).
2. Nineteen per cent of schools at present using Homogeneous Streaming intended to introduce non-streaming or to extend it beyond the first year.
3. Thirty-six per cent of schools using non-streaming 'streamed' their fourth year pupils, but 24 per cent intended to change this and unstream them.
4. The main advantages claimed for non-streaming were: pupils more socially adjusted (51 per cent); pupils not labelled A, B, C (27 per cent); wide ability range (22 per cent); contented staff/easier for staff (23 per cent).
5. The main advantages claimed for Homogeneous Streaming were: easier for the staff/contented staff (23 per cent); smaller ability range in the class (19 per cent); more attention to the backward (22 per cent); meets the needs of the child (19 per cent); and higher standard of attainment (18 per cent).
6. Advantages claimed by schools using Vertical Streaming were similar to those of schools using Homogeneous Streaming.
7. Advantages claimed for grouping according to age in middle-sized schools were similar to those claimed for non-streaming (see above).
8. Advantages given by/for small schools represent advantages resulting from being in a small school, rather than from particular types of organisation. The main advantages claimed were: more individual attention; child's needs met; happy family atmosphere.
9. Special difficulties encountered by head teachers were: mainly inadequate number of staff; large classes; inadequate accommodation; too wide ability range and age range within the class.
[page 554]
Over 50 per cent of head teachers mentioned some special difficulty. Middle-sized schools mentioned the shortage of staff more often than other schools.
8. SOME GENERAL FINDINGS OF THE SURVEY
1. Qualified and unqualified staff
Seventy-one per cent of all schools were entirely staffed by qualified teachers. The larger schools were more likely to have an unqualified teacher. Schools using Homogeneous Streaming and Non-Streaming were equally well staffed.
2. Staff Turnover
This was related to the size of the school but not to the type of school organisation.
3. Accommodation
Large schools had better facilities; they were more likely to have a room for the head, a staffroom and a school hall. Schools using vertical streaming were more likely to have a spare classroom than schools using any other type of organisation.
4. Schools of Different Socio-Economic Categories
Schools classified as middle class or upper working class were compared with those classified as middle or lower working class.
It was found that the latter group tended to be worse off in terms of number of unqualified staff and turnover of staff. Their heads spent more time teaching. Also they were less well provided with accommodation - however, these schools tended to be small in size, which would explain this finding. The socio-economic categories were based upon the head's subjective estimate and the above findings must be interpreted with caution.
PART II
The Effects of Streaming and Non-Streaming in Junior Schools
SECTION 1
INTRODUCTION
1.1 The aims of the investigation
The inquiry was initiated at the request of the Department of Education and Science and was designed to study the effects of streaming and non-streaming in junior schools.
The aim of the project is to provide evidence concerning the ways in which children are assigned to different classes, and grouped within their classes, in both streamed and non-streamed schools; the attitudes of teachers towards these various forms of organisation, the methods of teaching they employ and the facilities with which they are provided; and, finally, the effects of different methods of grouping and treatment on the attainments, personalities and social adjustment of the pupils concerned.
To this end, the inquiry has been undertaken at three levels:
1. A broad survey of grouping practices in a nationally representative sample of junior schools.
2. A comparative study of 50 matched pairs of streamed and non-streamed junior schools.
3. An intensive study carried out in 10 junior schools.
[page 555]
1.2 Caution
A report of the survey of practices in junior schools was completed and submitted to the Plowden Committee earlier in the year. (1) The study of 100 schools (50 matched pairs of streamed and non-streamed junior schools) falls into two parts: a longitudinal study of pupils over four years and a cross-sectional study which enables certain preliminary comparisons to be made between the two types of organisation based upon samples of children, at present in different years of their course. It is this cross-sectional study with which this Report is concerned. The longitudinal inquiry, which should yield more reliable information concerning the effects of the contrasting forms of organisation, cannot, of course, be completed until the four years, planned for the follow-through, have elapsed.
In interpreting what follows, it should be remembered that all the findings are based upon cross-sectional data and that this kind of information has certain disadvantages. The most notable of these is that inferences about the growth of children based upon two groups, tested at the same time, but differing in age, are less reliable than inferences about the same group of children tested or examined at intervals. One cannot, in fact, legitimately generalise from one year group to another and assume that, because the ten year olds of the present sample behaved in certain ways, the seven year olds will resemble them closely three years from now. Nor, in cross-sectional samples can conclusions be drawn about the direct effects of a change in organisation or in placement, particularly as this may affect children of initially different levels of ability. It is hoped that the follow-through studies will enable firmer conclusions to be drawn in these respects.
A further limitation should be noted. Not all the data from the cross-sectional study could be analysed in time and a number of important questions - the answers to which might well qualify some of the statements made - have had to be left aside for the present. Where this is so, and where it is reasonable to suppose that subsequent analysis may throw a new or different light upon the interpretation of the factual data given, this is pointed out in the text. Finally, it should be emphasised that the question - to stream or not to stream? - reveals itself, as the research continues - to require a far more complex and nuanced answer than the propagandists on both sides would have one believe.
1.3 The sample of 100 schools
As a result of the major survey, details of a large number of streamed schools and of 43 non-streamed schools were available. To increase the size of the non-streamed sample of schools, the Foundation wrote to all local education authorities in England and Wales, asking for addresses of all non-streamed schools. These schools were invited to complete a questionnaire and on the basis of the information thus provided, a further 55 non-streamed schools were selected.
Each of the non-streamed schools was then matched with the most similar streamed school which could be found, using the following criteria for matching:
(a) Type of school: junior or junior-with-infants; urban or rural.
(b) Number of classes in the school.
(1) Part I pp. 544-554
[page 556]
(c) Average number of pupils per class.
(d) Geographical region.
(e) Percentage of children in LEA attending non-selective schools.
(f) Predominant socio-economic class of parents.
(g) Approximate matching of percentage of parents in professional, clerical and skilled occupations.
All the schools were non-denominational and all were situated in England. In this way, a sample of 100 schools was obtained. Further details of the procedure employed for matching the pairs can be found in Annex I.
1.4 Exploratory Research
One aim of the inquiry is to discover whether children tend to reach higher levels of achievement in the basic school subjects under one system than under the other. For this purpose, tests of attainment are, of course, appropriate. Another stated aim is to examine the effects of streaming and non-streaming on children's personality characteristics and social adjustment. In these areas, however, the choice of suitable measuring instruments depends on the identification of modes of behaviour that are both relevant and susceptible to reasonably objective appraisal. For example, there are references in the literature to concepts such as 'the atmosphere of the school'. Clearly such a concept needs to be defined in operational terms before any meaningful assessment could be undertaken. Furthermore, it is reasonable to suppose that some of the outcomes of streaming or non-streaming depend not so much on the forms of organisation per se as on the attitudes and practices of the teachers who operate within them.
For these reasons it was felt essential to carry out exploratory research, in order to discover which aspects of the school, teacher, and pupil could and should be given particular attention in the 100 schools study.
The exploratory research involved six streamed and six non-streamed schools (not included in the 100 schools sample) and consisted of interviews with the heads and staff, and visits to classes. The staff who were interviewed were selected so that the sample included both men and women, with varying amounts of experience and teachers of different year-groups and different streams. Thirty-one interviews were carried out - each lasting about one hour. These interviews were unstructured, so that the teachers could express their views freely, as well as explain their methods of teaching. Each interview was taped and later transcribed.
1.5 The significance of 'traditional' and 'progressive' teaching methods and attitudes
The interviews and the visits to schools suggested that teachers in streamed schools differed from those in non-streamed schools. both in their teaching methods and in their attitudes.
It also became clear that these differences between teachers in their methods and attitudes might possibly outweigh the effects of streaming or non-streaming per se. A good deal of attention was therefore given to the construction of questionnaires to assess the method of teaching and the attitudes
[page 557]
of the teachers. These questionnaires were based upon the activities described and the opinions offered in the interviews. (See Section 2 for further details of Questionnaires S.1 and S.3.)
1.6 Hypotheses
On the basis of the interviews and visits, a number of hypotheses were formulated, some for testing in the cross-sectional study and others in the longitudinal study. Outlined below, are those hypotheses tested in the cross-sectional study and discussed in this Report. Indicated beside each hypothesis is the number of the section in which it is discussed.
(a) Streaming and non-streaming may have different effects on children's attainments. (Section 3.)
(b) Pupils' attainments may be affected by the methods of teaching used, irrespective of the type of organisation chosen by the school. (Section 3.)
(c) Pupils' attainments and social behaviour may be influenced by teachers' attitudes. (Section 4.)
1.7 Number of schools/teachers/pupils involved in the cross-sectional study
Although the project started with 100 schools, for various reasons certain schools had to be excluded, so that data from only 84 schools, 42 streamed, 42 non-streamed, were analysed in the cross-sectional study. Details of the 42 matched pairs of schools can be found in Annex 1.
Eight hundred and seventy-one teachers and approximately 30,000 junior pupils were involved in the cross-sectional study.
SECTION 2
THE CHARACTERISTICS AND ATTITUDES OF
TEACHERS IN STREAMED AND NON-STREAMED SCHOOLS
2.1 Introduction
It will be recalled that the two samples of 50 schools were matched as far as possible for their principal characteristics - size, socio-economic status, geographical location, and so on - and were differentiated by their choice of internal organisation, into streamed and non-streamed schools. The interviews and visits carried out, as exploratory research, suggested that this difference in organisation was reflected in, or arose from, very different views held by the teaching staff which in turn affected the choice of teaching methods.
From the material recorded at the interviews therefore, three questionnaires were devised to enable this hypothesis to be tested in some depth.
2.2 Information supplied by class teachers
The first of these questionnaires was concerned with biographical information, sex, age, experience and training.
The second was concerned with more or less objective information about the methods of teaching used and the ways in which children were organised for learning. It fell into three sections:
(a) A section dealing with the classroom facilities as perceived by the teachers. This yielded a composite 'facilities' score.
[page 558]
(b) A section in which teachers were asked to indicate how often they used various types of lesson, for example 'formal sums'. From the responses made, two scores were derived: a 'traditional lessons' score, indicating how often the teacher used lessons of the more 'traditional' type and a complementary 'progressive lessons' score. Each of these scores was studied by the method of item analysis, in order to eliminate items (i.e. types of lesson) which were not correlated with the total score. The final versions contained the following items:
'Traditional' - writing class-prepared compositions; learning lists of spellings; formal grammar -understanding parts of speech; saying and learning tables by rote.
'Progressive' - projects - in which the child does his own 'research'; pupils working or helping each other in groups; practical arithmetic, e.g. measuring, apparatus work; free activities.
(c) A section on the use of class teaching, mixed ability group teaching and ability grouping within the class.
The third questionnaire was used to study teachers' attitudes. It took the form of a number of statements of opinion, which had actually been made by other teachers in interviews. Each teacher was asked to indicate his degree of agreement or disagreement with each statement, using a five-point scale ranging from 'strongly agree' to 'strongly disagree'. The questionnaire contained six sub-sections, and each teacher's responses could be scored separately on each section. (The items which were included in the attitude scales had been selected by Guttman's method of scalogram analysis. A table of reproducibility coefficients is given in Annex 3. (1)) These six sub-sections were: 'Permissive'/'Obsessional'; attitude towards physical punishment; attitude towards eleven plus selection; attitude towards noise in the classroom; attitude towards streaming; attitude towards A stream children.
2.3 A comparison of Streamed and Non-streamed schools
Although, of course, few teachers or schools conformed to a clear-cut average, the analysis of the data revealed a considerable degree of polarity between the two types in terms of the age and experience of the teachers, the methods they chose to use and their perception of the facilities available to them. Table I on the following page brings this out clearly, indicating that, with one exception, all the differences found are statistically significant and (where this is appropriate) point in the same direction. The climate in the unstreamed school - if we are to judge by what its teachers say about themselves, their methods and their attitudes - is more permissive and tolerant, less structured and places less emphasis on the more traditional methods of class teaching than its streamed counterpart. Since, moreover, all the traits studied proved to be intercorrelated positively, this suggests that they are something more than an arbitrary collection of more or less discreet [discrete] and separate characteristics; that they do represent a coherent pair of opposing syndromes, likely, if they are at all intense in anyone school, profoundly to affect the pupils exposed to them.
(1) For further details, see STOUFFER, SA, GUTTMAN, L, et al. Measurement and Prediction, Princeton, NJ, 1950.
[page 559]
Table I
Differences Between Streamed and Non-Streamed Schools
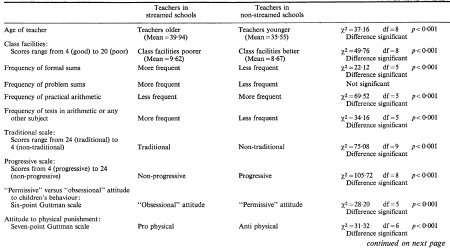 [click on the image for a larger version]
[page 560]
Table I - Differences Between Streamed and Non-Streamed Schools - continued
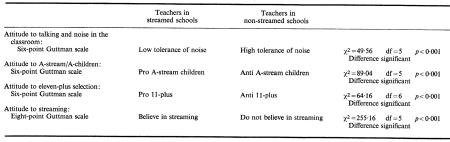 [click on the image for a larger version]
[page 561]
It must be emphasised, however, that these (Table I) are central tendencies and some elucidatory comment is perhaps required.
2.4 Age and Experience of Teachers in the Two Types of School
In general, a higher proportion of the teachers in non-streamed schools tend to be younger and to have less experience than those in streamed schools.
Table II
Age Distribution of Teachers in Streamed and Non-Streamed Schools
| Streamed | Non-streamed |
Top
quartile | Median | Bottom
quartile | Top
quartile | Median | Bottom
quartile |
| Age of teacher | 49.6 | 39.3 | 29.2 | 44.4 | 32.7 | 26.0 |
Table II shows that a quarter of the teachers in non-streamed schools are aged 26 or below, whilst a quarter of those in streamed schools are verging on their fifties or are older. However, the overlap in age and experience is in fact greater than the difference.
As a group, younger teachers tended to have more 'progressive' opinions, particularly in their rejection of eleven plus selection, their 'permissiveness' and their 'tolerance of noise'. Those with two years' experience or less were the most hostile to 11-plus.
2.5 Class Facilities
According to the teachers, the facilities (good lighting, new desks, little outside distraction, plenty of space, etc.) in the unstreamed schools were better. It should be emphasised that this reflects what the teachers thought about what they had, and is not derived from a strictly objective comparison; but there is no reason to suppose that the non-streamed schools were not in fact superior in this respect.
2.6 Teaching Methods
Teachers in streamed schools, on average, tended to make more frequent use of 'traditional lessons' and less frequent use of 'progressive lessons' than teachers in non-streamed schools. But the greater frequency of 'traditional lessons' (streamed schools) was in fact more true for teachers of seven plus children than for teachers of the ten year olds, not surprisingly when one considers the meaning of 'traditional lessons' at the different ages. 'Traditional lessons' could be defined as learning the basic skills in a formal way - an activity considered important for seven year olds even by 'permissive' teachers (there was no correlation between use of 'traditional lessons' and attitudes for the teachers of seven year olds). But by the time a child reaches the fourth year of the junior school, fewer teachers believe in the necessity for daily recitation of tables or practice in formal sums. The teacher who did use 'traditional lessons' at ten plus, tended also to be 'obsessional' in outlook (1) (the correlation between the use of 'traditional lessons' and the 'permissive'/'obsessional' scale was 0.327).
(1) For the meaning of this, see Section 2.7 and Annex 3.
[page 562]
The greater frequency of 'progressive lessons' (1) in non-streamed schools was in fact more striking in the case of teachers of ten year old children than in that of teachers of seven year olds. The use of 'progressive lessons' also was found to be correlated with the teacher's 'permissiveness' in fourth year classes, but less so in the earlier years. One possible explanation for the low correlation between teacher attitude and use of 'progressive lessons' at seven plus is that use of apparatus (e.g. Dienes, Cuisenaire) and consequent group work is becoming increasingly common with these year groups and is introduced by the school rather than being chosen by the individual class teacher. Lessons in formal sums (i.e. mechanical computation) and arithmetic tests and other tests were more frequent in streamed schools whereas practical arithmetic, in general, and the use of apparatus, were more common in non-streamed schools.
In the streamed schools, perhaps in accordance with their greater emphasis on structuring experiences, on teaching children in specific ways and upon the more traditionally systematic and formal approach, significantly more use was made of tests of various kinds to check progress and diagnose difficulties. The only aspect of method studied which did not yield a statistically significant difference was that concerning the use of sums in problem arithmetic. It is possible that differently organised schools are in fact similar in this respect; alternatively the test itself may not have been sufficiently discriminative to detect any difference which might exist.
Table I has shown the difference between schools over all year groups; while Table III, below, shows the frequency of different types of arithmetic lessons at seven plus and at ten plus. Note that there are no significant differences in the frequency of problem sums at seven plus or formal sums at ten plus.
(1) For the 'progressive lessons' scale see paragraph 2.2
[page 563]
Table III
Frequency of Tests and of Different Types of Arithmetic Lesson in Streamed and Non-Streamed Schools
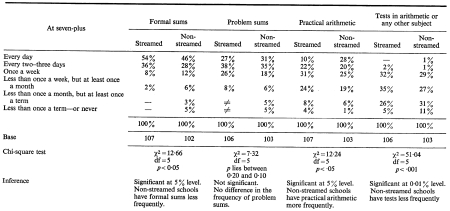 [click on the image for a larger version]
continued on next page
[page 564]
Table III - Frequency of Tests and of Different Types of Arithmetic Lesson in Streamed and Non-Streamed Schools - continued
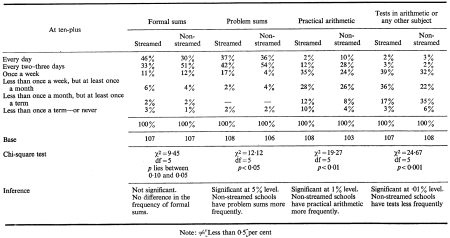 [click on the image for a larger version]
[page 565]
The general differences between the two types of school are summed up in the composite score on the two complementary 'traditional' and 'progressive' scales. How these are distributed is shown in Table IV which sets out the medians and quartiles of the two groups.
Table IV
Traditional and Progressive Scores of Teachers in Streamed and Non-Streamed Schools
| Streamed | Non-streamed |
Top
quartile | Median | Bottom
quartile | Top
quartile | Median | Bottom
quartile |
| Traditional | 17.4 | 15.4 | 12.8 | 15.6 | 13.3 | 10.6 |
| Progressive | 17.3 | 14.9 | 12.5 | 15.3 | 12.4 | 9.5 |
It should be noted that, on both scales, scores range from four to 24 and that the medians are considerably nearer the 'traditional' and 'non-progressive' ends of the scale. In terms, therefore, of the views expressed, teachers in both types of school are fairly 'traditional'; the difficulties between them would seem to be nuances rather than marked divergences of opinion.
2.7 Attitudes of Teachers in Streamed and Non-Streamed Schools
The exploratory research indicated a number of fundamental attitude areas that are relevant in this inquiry. Each area could be represented as a dimension along which teachers could be placed according to the degree to which they manifest the attitude. Six attitude areas were investigated, namely:
(a) 'Permissive'/'Obsessional'
(b) Attitude towards physical punishment
(c) Attitude towards noise in the classroom
(d) Attitude towards A stream children
(e) Attitude towards 11-plus selection
(f) Attitude towards streaming.
The titles of the scales are self-explanatory, with the possible exceptions of (a) and (d); of which more details are given below. It will be noticed, too, that three of these attitudes are of a fairly specific kind and may give some indication of the way in which teachers are likely to react to their pupils and of the kind of climate they will create in the classroom (a, b, and c scales). The remaining three concern views of a socio-political nature and may be said to form a part of a more general system of values.
(a) 'Permissive' versus 'Obsessional'
This scale was intended to rank teachers in terms of the 'permissiveness' of their attitudes towards junior school children. The labels 'permissive' and 'obsessional' must not, of course, be interpreted literally. It is convenient to use some title to describe those teachers who were most prone to object to children fidgeting, to demand clean hands and good manners; the teachers who rated the three Rs more highly than 'self-expression' and vice-versa.
[page 566]
There was a tendency (highly significant statistically) for teachers in non-streamed schools to be more 'permissive' in this sense than those in streamed schools. For the content of this scale, see Annex 3, Items 6, 14, 17, 20, 23.
Graph No. 1
Permissiveness
Item 20. Naturalness is more important than good manners. (Extreme group.)
31.33 per cent N.S. agree
82.4 per cent S. disagree
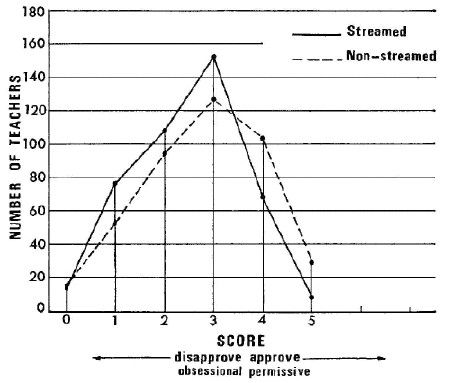
It will be seen from the graphs that the distribution of the scores for the two groups of teachers is very similar, and in fact, the modal statement was the same. The difference arises from a group of teachers in non-streamed schools who hold firm views towards the extreme of the scale. The statement which most clearly differentiates the streamers from the non-streamers is quoted above the graph.
(b) Attitudes towards physical punishment
There was, too, a similar tendency (p<0.001) for teachers in non-streamed schools to show disapproval of physical punishment and in streamed schools to show approval. The items forming this scale can be found in Annex 3 (items: 4, 11, 13, 22, 25, 30).
[page 567]
Graph No. 2
Attitude to Physical Punishment
Item 11. Physical punishment does no good at all to any child. (Extreme group.)
24 per cent N.S. agree
88 per cent S. disagree (i.e. 12 per cent agree)
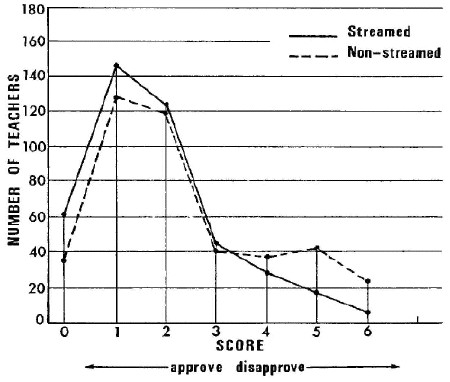
It will be seen from the graph that, as with 'permissiveness', the difference arises principally from a small group in the non-streamed schools who have extreme scores on the scale. The statement most clearly differentiating the two groups is that concerning physical punishment in general.
(c) Attitudes towards noise in the classroom
The differences between teachers in streamed and non-streamed schools were highly significant (p<0.001). Teachers in non-streamed schools were tolerant of noise (Annex 3 Items: 2, 7, 18, 27, 31) and in streamed schools less tolerant.
[page 568]
Graph No. 3
Attitude to Noise
Item 31. A quiet atmosphere is the one best suited to all school work.
56 per cent N.S. disagree
62 Per cent S. agree (i.e. 38 per cent disagree)
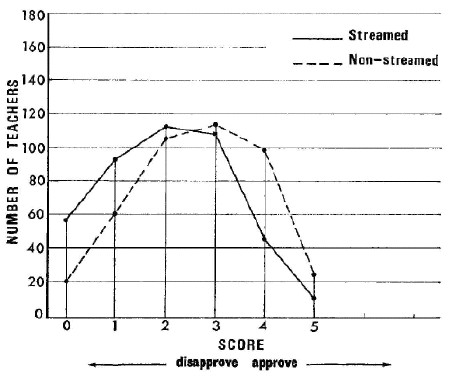
Graph No. 3 shows a clear displacement of scores of the teachers in non-streamed schools towards one end of the scale with differences on most of the statements.
The three more general attitude scales also differentiate between teachers in the two types of school, and if indeed they reflect strongly held views, may deeply influence pupil-teacher relationships.
(d) Attitude towards A-stream children
On this scale individuals rank themselves in terms of attitudes towards children in A-streams. It contained items suggesting that A-stream children worry about marks, tend to become conceited, etc. (see Annex 3, Items: 3, 5, 8, 10, 26). Teachers in streamed schools had a more favourable attitude to A-stream children - presumably believing in the value of A-streams for bright children - than teachers in non-streamed schools. The difference was significant (p<0.001).
[page 569]
Graph No. 4
Attitudes to A-stream Children
Item 5. Children in A-streams tend to become conceited about their abilities. (Most discriminating statement.)
69 per cent N.S. agree
59 per cent S. disagree
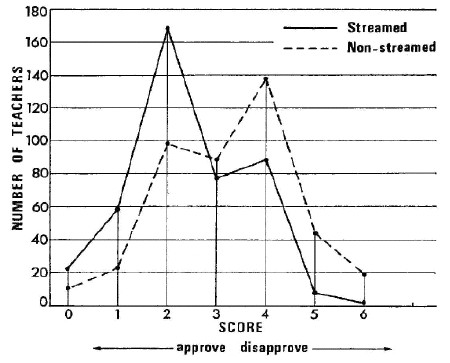
Here the graph shows a rather different distribution with a clearer division of opinion - certainly among substantial groups of teachers in the two types of school. The most discriminating statement is, it will be noted, concerned with the attitude attributed to children.
(e) Attitudes towards 11-plus selection
Teachers in non-streamed schools tended to disapprove of selection, while teachers in streamed schools tended to approve. The difference was highly significant statistically (p<0.001). (See Annex 3, Items: 9, 12, 16, 21, 29).
[page 570]
Graph No. 5
Attitude to the 11-plus
Item 11. The 11-plus examination is an entirely fair method of assessing a child's abilities. (Most discriminative statement.)
69 per cent N.S. disagree
56 per cent S. agree
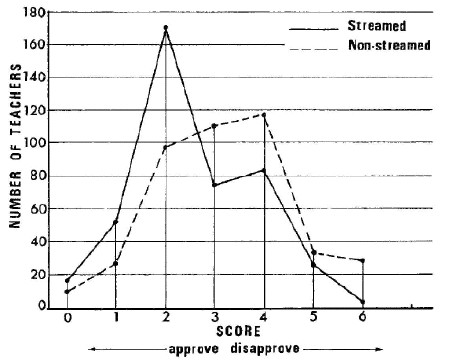
There seems to be a considerable spread of opinion in both groups about this with, however, the bulk of teachers in non-streamed schools further towards one extreme than their colleagues. Two points are worthy of note: that the most discriminating statement concerns the justice of the 11-plus; and that substantial proportions of teachers in both groups are opposed to the system.
(f) Attitudes towards streaming
In many ways this attitude scale is the most important for this research project. If a class teacher does not share the beliefs of his head teacher about the advantages of streaming or non-streaming, it is possible that these advantages will not be realised. This scale can be used as a means of identifying teachers who are committed to one point of view or the other. It has been found that in streamed schools there are some teachers who favour non-streaming, and in non-streamed schools there are some teachers who favour streaming, and in both types of school there are teachers who are uncommitted either way. However, the average differences between teachers in streamed and non-streamed schools were highly significant (p<0.001).
The attitudes of teachers towards streaming were studied in greater detail in order to discover the extent of teachers' agreement with their school's policy. As a first step the attitude scores were used to categorise the teachers into three groups ('pro-streaming', 'neutral' and 'anti-streaming') according to Guttman's method of intensity analysis. (1)
(1) GUTTMAN, L. and SUCHMAN, EA, Intensity and a zero point for attitude analysis, American Social Review, 12, 57. 1947.
[page 571]
Table V, below, shows the proportion of teachers in each attitude category.
Table V
Attitudes of teachers according to type of school organisation
| Pro-
streaming
% | Neutral
% | Anti-
streaming
% | Total
% | Base |
| In streamed schools | 45 | 45 | 10 | 100 | 422 |
| In non-streamed schools | 13 | 35 | 52 | 100 | 420 |
The first point to be noted is that substantial proportions of teachers are in favour of streaming. Since of all junior schools in the country which are large enough to do so, at least 65 per cent stream and only 11 per cent clearly do not, (1) it seems reasonable to suppose that the majority of junior school teachers in England and Wales are in favour of the practice, that a substantial proportion are undecided, and that only relatively few are firmly committed to the opposing view. This finding must be stressed at a time when some writers suggest that the death knell of streaming has already sounded. Coupled with the finding concerning parents' views, reported later in this report (Section 6), it suggests that any universal change recommended may meet with considerable opposition - particularly since the attitudes for or against streaming seem to form part of a whole syndrome of views, practices and beliefs.
An examination of Table V also suggests that on the average, there appears to be one teacher in each school whose views are in conflict with the policy of the school. This, however, is rather misleading. A more detailed analysis revealed that in a few schools less than half the staff were in agreement with the head's policy, while in others all were in accord. Similarly, there were differences (discussed in Section 5) in the views of A, B, C and D-stream teachers.
(1) See Part I, page 550.
[page 572]
Graph No. 6
Attitudes to Streaming
Item 24. The bright child will be neglectedin non-streamed classes.
74 per cent N.S. disagree
79 per cent S. agree
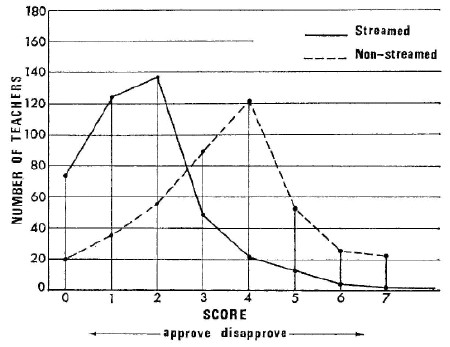
This graph reveals a pattern of response most clearly differentiating the two groups of teachers. Whereas in both groups (as Table V showed more clearly) there are those whose opinions are contrary to the practice of their school, in each the majority seem to adhere to the appropriate norm. The most discriminating statement, significantly, is the one which touches on the fate of the bright child in a non-streamed school. A clear majority of teachers in streamed schools agree that such a child will be neglected; a comparable majority in non-streamed schools oppose this view.
2.8 Streamed and Non-streamed schools embody different philosophies
It seems apparent from the foregoing that schools using streaming or non-streaming do not merely differ in their organisation: and indeed that the strictly organisational aspects may be the least important in their bearing upon the development of the pupils. The streamed school seems to be more systematic in its approach, concentrates more on conventional lessons, gives more attention to the 3Rs and is likely to be more 'traditional' and at least overtly more authoritarian. Its staff is likely to be somewhat more experienced and older, to approve of bright children, of 11-plus selection and of streaming as a means of adapting to individual differences. The unstreamed school presents an apparent contrast. Its younger teachers hold more 'permissive' views on such things as noise, cleanliness and manners; they disapprove of physical punishment and of the differentiation implicit in streaming and in the 11-plus procedures. Their teaching tends to place more emphasis on self-
[page 573]
expression, learning by discovery and practical experience. In short, the aims and practices of the two kinds of school seem to embody different views about children and different philosophies of education.
In practice, however, the contrast is probably not so marked as this dichotomy may seem to imply, although, of course, specific schools, where staff and head share very firm convictions, may represent quite thorough-going, even doctrinaire, embodiments of these contrasting approaches. In view, however, of the frequency of streaming in junior schools, it is clear that it is the non-streamed school which, in the statistical sense at least, is deviant. It would also appear that the staffs of non-streamed schools are slightly more in agreement with each other than with the rest of their colleagues. How far this is due to teachers choosing non-streamed schools on account of their views and how far it is due to the influence of the school and the head, it is difficult to say. It seems possible that some of the heads of non-streamed schools, because they are using a new and fashionable method, have been accorded special treatment by their LEA and allowed to select teachers in accordance with their own viewpoint.
Many of the questions raised by this part of the study can be answered only by further analysis and the collection of additional data. One thing is, however, clear and should be kept in mind with regard to Section 3. Any effect which may be shown to be associated with streaming or non-streaming is unlikely to be purely and simply due to the form of organisation used. Teaching method, the ideas which underlie disciplinary systems, the views about children held by their teachers - in short the whole climate of relationships built up by what teachers say and do and what they appear to their pupils to imply, may well be the critical factors. The comparisons which follow will show the broad differences associated with contrasting types of general attitude and consequent organisation. In many schools of both types, however, there are teachers whose views and at least some of whose practices, are in conflict with those of their colleagues. One might expect the influence of such teachers to attenuate any differences that might result from the differences in organisation. The extent and nature of this it will only be possible to elucidate in the later comparisons.
SECTION 3
COMPARISON OF ATTAINMENTS IN STREAMED AND NON-STREAMED SCHOOLS
3.1 The difficulty of finding tests which favour neither type of organisation
Tests of reading, English, mechanical arithmetic and problem arithmetic were given to the pupils in all four junior years in the cross-sectional study. Each test was devised to be suitable for all ages from seven plus to ten plus, so that in the longitudinal study, measures of gain in achievement could be made. These tests were specially produced for this project by the test service of the NFER, and their content was of the kind usually demanded for juniors by teachers and education authorities. As was pointed out earlier, however (paragraph 2.7), the teaching methods and the aims of the streamed schools are typical of the majority, whereas non-streamed schools in which teachers held different views are in the minority: hence, the tests used in the cross-
[page 574]
sectional study probably reflect the majority view of teachers. In this sense, they can legitimately be held to be biased against the non-streamed schools, in that they favour outcomes of methods of teaching to which less attention is paid in these schools, and do not include measures of some of the objectives which many non-streamed schools consider to be of great importance. On the other hand, it might reasonably be argued that the bias implicit in the tests is a correct one. On this we hold no views, the important point to make here being that the comparison, at this stage, is in terms of the norms and objectives of the majority of teachers. Comparisons have yet to be made on the basis of how far other aims and objectives proposed by the non-streamers are attained.
3.2 The tests
Of the four attainment tests used, the most impartial was probably the reading test. Both types of school share the aim of teaching children to read with understanding and, within its limitations, the test gives an accurate measure of how far this has been achieved. The test does not, of course, give a measure of the use and enjoyment of reading, nor can the inquiry furnish evidence of this at the present stage.
The test of English is rather more 'biased'. It consists principally of tests of comprehension, probably important in themselves for both groups, but on which children who have had some formal practice and teaching are likely to have at least a marginal advantage. Also included in the test are some items based on formal grammar (parts of speech, punctuation) which would favour those pupils whose teachers scored highly on the 'traditional lessons' scale and such teachers were more common in streamed schools.
The two tests of arithmetic are somewhat different from each other. One was concerned with problem arithmetic and since this was that aspect of teaching which did not differentiate between the two kinds of school and teacher, it is reasonable to assume that any bias was probably slight. The test of mechanical arithmetic is another matter. Table I indicates that, over all year groups, daily practice in formal sums was more common in the streamed schools, and one would expect that this would result in a greater facility in this test. Any differences found here then might perhaps be ascribed to the teaching method used rather than to the form of organisation as such. (See Footnote on following page.)
In addition to the attainment tests, two measures of ability were used: the NFER Primary Verbal Test I was given to children in the second, third and fourth years; and a Verbal/Non-verbal test, yielding two separate scores was given to fourth year children. (1) This latter test was the one used in 1957 in the Population Investigation Committee Follow-up Study (Douglas JWB, The Home and the School.)
Finally, it should be stated that two parallel versions of the attainment tests were used. A random half of the schools worked the A version and the other half the B ones. This has the advantage that, in effect, two independent studies were carried out simultaneously and each acted as a check upon the other.
3.3 The results of the Attainment testing
The overall results of the attainment testing suggest that, on the various outcomes measured, pupils in streamed schools performed better than their
(1) Budgetary considerations forbade the use of this test for the younger age groups.
[page 575]
counterparts in non-streamed schools. Most of the differences found were statistically significant.
Few of the differences, however, were large; most amounted to less than one third of a standard deviation and only those derived from the mechanical arithmetic score approached or surpassed half a standard deviation. In effect, what these differences mean is that, on the average, the streamed group got two or three more answers right in tests having 30 or 40 items in them. Some would consider this a small price to pay for non-streaming, if other educational and personal advantages were obtained. (1)
Attention should also be drawn to another feature of the score distributions. In attempting to interpret, in educational terms, statistically significant differences in mean scores, one must ask whether the higher or lower marks were spread similarly in the compared groups or whether the difference is due mainly to a larger proportion in one or other group, obtaining higher or lower marks. The standard deviation of the test scores showed that in streamed schools there was less homogeneity in performance and that more children in these schools were getting higher marks. There was little difference in the percentage of children scoring low marks in the two groups of schools. The most likely interpretation of this seems to be that the most able children in the streamed schools score more highly than do their counterparts in the unstreamed ones. This may or may not be true, however, the longitudinal study should provide more reliable evidence.
The table which follows below illustrates two other points. It shows the correlations, at the beginning and at the end of the junior school, between the type of organisation used by the schools and the results of the four tests of attainment. It will be noticed that, whereas in every case except one the correlations reflect the superiority of the streamed schools in the aspects of attainment measured, there are two gradients of what might be called the intensity of association.
Table VI
Correlation between type of school and test
| Mechanical
arithmetic | English | Problem
arithmetic | Reading |
| At seven plus | 0.256 | 0.139 | 0.104 | 0.097 |
| Inference | Significant at 1%. Streamed schools better. | Significant at 1%. Streamed schools better. | Significant at 1%. Streamed schools better. | Significant at 1%. Streamed schools better. |
| At ten plus | 0.168 | 0.062 | 0.081 | 0.038 |
| Inference | Significant at 1%. Streamed schools better. | Significant at 5%. Streamed schools better. | Significant at 1%. Streamed schools better. | Non-significant. No difference. |
(1) The cross-sectional study had to be mounted rapidly and there was not time to devise measures of the less conventional and traditional objectives of primary education. For the longitudinal study, the tests described above are being supplemented by others devised to be more in accord with the aims and philosophy expressed by the non-streamed schools. In particular, a new arithmetic test has been devised to assess children's understanding of mathematical principles and another concerned with creativity, is being constructed to redress somewhat the balance in the measures of attainment in English. [Note. The reference to this footnote was missing from the text. I have placed it where it seems to be appropriate.]
[page 576]
The more the test reflects 'traditional' educational practices and emphases, differentiating the two kinds of school, the closer the association is found to be. It is at its highest for mechanical arithmetic and at its lowest for reading. English and problem arithmetic occupy intermediate positions. Secondly, it is apparent that the associations are strongest at seven plus and weakest at 10 plus. Other workers have found that children taught by 'progressive' or 'active' methods tend to make a slower start, but catch up with those taught by more 'traditional' methods by the end of the primary school. (1, 2)
3.4 Conclusion
In concluding this section, it is necessary to remind ourselves that this Report is concerned with cross-sectional data and that therefore comparisons between successive age groups are of dubious validity. It should be noted that although the two groups of schools were matched as far as possible, one slight difference did emerge. The streamed schools had slightly more pupils from somewhat higher social backgrounds (see Annex 1). Further, the test of verbal ability given to the second, third and fourth year pupils revealed a small superiority in the eight and nine year old children in the streamed schools, though neither this test, nor the verbal/non-verbal test showed any marked difference in the10 plus groups. The superiority of second and third year children on the verbal ability test in streamed schools could be a result of the school organisation, and is not necessarily a cause of the attainment differences found in the two types of school.
Finally, we would draw attention to something which is a feature of the streamed schools and which might have a bearing upon the test results - at least in a marginal way. Table I (Section 2) shows that children in streamed schools were more frequently tested, though not necessarily with standardised tests of the kind used in this study. It is thus possible that they were more 'test wise' or at least more habituated to test situations.
These cautions are reiterated to guard against too much emphasis being placed on the results of this part of the inquiry. As they stand they lend small support to the controversialists on either side. They indicate that organisational factors may well mask more important and pervasive influences and that these are perhaps less obscurely to be discerned in the facts reported in Section 2. They also indicate that the effects of teachers' beliefs and attitudes are to be looked for not so much perhaps in differences in formal attainments as in children's beliefs and feelings about themselves and their underlying attitudes to school and what it stands for. (3) It is not in the nature of cross-sectional evidence to throw much light upon questions such as this, though we may hope that something will emerge from the follow-through study. One point does, however, seem to be clear. A mere change in organisation - the abandonment of streaming, for example - unaccompanied by a serious attempt to change teachers' attitudes, beliefs and methods of teaching, is unlikely to make much difference either to attainments or - though this is less certainly based on the present evidence - to the quality of teacher-pupil relationships.
(1) MORRIS, J, Standards and Progress in Reading, NFER publication (to be published in 1966).
(2) GARDNER, DEM, Testing Results in the Infant School; Long term Results of the Infant School.
(3) Attitudes of children will be measured in the longitudinal study.
[page 577]
SECTION 4
THE INFLUENCE OF TEACHERS' METHODS AND ATTITUDES
4.1 Introduction
It has often been suggested that a teacher's effectiveness depends upon his attitudes more than upon his qualifications or even his length of experience. Thus, the individual teacher's attitudes towards streaming may be predicted to have some effect upon his pupils, modifying to some extent the effect of the school's policy of streaming or non-streaming.
This, it would appear from earlier sections, is probably one of the most crucial problems of the whole streaming research. Unfortunately, in the time at our disposal, it has not been possible to go into it as thoroughly as even this cross-sectional data warrants. What follows in this section is a partial examination of the problem. We have been able to examine certain sub-groups of teachers in non-streamed schools and to show some relationship between the teachers' attitudes and their pupils' performances. This section must be regarded as exploratory and is only a 'first look' at the data.
Two probes have been made, both based upon contrasting groups of teachers in non-streamed schools. The unstreamed schools were chosen simply because any effects which the views and practices of teachers might have upon the performance and personality variables of their pupils, would not be complicated or concealed by the differences in status of A, B and C streams. From among the 226 teachers of nine and 10 year old children, in the non-streamed schools, the 28 most convinced supporters of streaming and the 24 most convinced supporters of non-streaming were chosen. Certain of the comparisons which follow (Table VII) are based upon these two groups. It was also possible, since the 'obsessive'/'permissive' scale tended to correlate with the streaming/anti-streaming scale, to distinguish two sub-groups within the supporters and opponents of streaming. Eight teachers who strongly favoured streaming were also at the 'obsessional' extreme on the appropriate scale, while 13 of the teachers who favoured non-streaming were at the extreme 'permissive' end. The comparisons which could be made between the pupils taught by these teachers are shown in Table VII.
Time has not permitted, even with these limited samples, the examination of all the possibly worthwhile questions and what follows is a somewhat arbitrary selection from among those variables which showed statistically significant correlations with teacher attitudes.
It should also be remembered that any relationships found would in any case be small and not very clear-cut, simply because each class had been with its teacher for less than one year. This is not very long for that teacher's influence to modify the effects of home background and previous teaching.
4.2 Some of the effects of teachers' attitudes to streaming
Table VII, on page 579, is based upon the two contrasting groups of teachers of third and fourth year children and upon the results of the attainment tests, a scale of 'test anxiety', a sociometric scale dealing with the number of friendless or isolated children in the class and one of the ratings made by the teacher concerned of the number of children considered a pleasure to have in the class. The data dealing with attainments are for the third year only (nine-
[page 578]
year-olds) since two analyses could not be done in the time and it would have been meaningless to study nine and ten year olds together on this particular variable. All the other analyses are based upon the nine and ten year olds considered as one group.
So far as attainments are concerned, the results sustain and even reinforce the findings of the broad survey. The scores achieved by the pupils whose teachers are in favour of streaming on mechanical arithmetic and on English are higher than those of the anti-streamers - this is strikingly so in mechanical arithmetic. The pro-streamers in the non-streamed schools made frequent use of 'traditional lessons' in contrast to the convinced non-streamers, which suggests that attitudes to streaming are closely related to teachers' preferred types of lesson, rather perhaps than to the particular ethos of the school in which they find themselves. Their use of more formal methods resulted in higher mechanical arithmetic scores although, in fact, their pupils tended to come, on the average, from homes slightly lower on the socio-economic scale, than those in the classes of the non-streamers. The differences in the scores on the English test - which is somewhat less open to the influence of traditional types of teaching - are much smaller and not statistically significant.
In the rest of the table there is the suggestion that the views and methods of the teacher have - in an educational system where differences between the 'progressives' and the 'traditionalists' may be ideologically considerable without resulting in more than marginal modifications in actual practice - a more marked effect upon the pupils' attitudes to themselves and to their work. The additional analyses of anxiety scores seem to point to this. It was found that the two samples did not match perfectly for socio-economic status and to check whether this might have influenced the results, the scores of girls from socio-economic group 3 (parents in the skilled category) were analysed separately. This confirmed the tendency for girls in classes under a pro-streaming teacher to display more anxiety about being tested than similar girls under an anti-streaming teacher. Girls of below average ability seem to have reacted in a similar fashion under either kind of teacher whereas their more able sisters showed considerably more anxiety under pro-streamers.
We might tentatively sum up this part of the table by saying that it confirms the common view that girls are more anxious than boys (which may account for their higher scores on mechanical arithmetic) and more responsive to nuances in the views and practices of their teachers. The less able girls probably find any kind of test a source of anxiety, but the brighter ones find them more anxiety-provoking with a teacher who believes in competition as a spur. What as yet we do not know from this data is how higher or lower scores on the test anxiety scale are related to higher or lower performances on the various kinds of test - that is, whether the anxiety (rather crudely displayed and measured) acts as a spur or an inhibitor.
The last four lines of the table show some apparently slight differences. There seem to be a few more children perceived as 'isolates' in the classes of the pro-streamers, a difference of about four per cent in the aggregate. This, however, only seems small until we consider the possibly serious distress which might be felt by the friendless, isolated child. The final line probably reflects a combination of two factors: the rather sterner view of discipline taken by the pro-streamers and perhaps the greater tolerance of those who generally dislike drawing too many distinctions.
[page 579]
Table VII
The effects of teachers' attitudes to streaming - a study of teachers of third and fourth year juniors in non-streamed schools
There were 28 teachers pro-streaming; there were 24 teachers anti-streaming
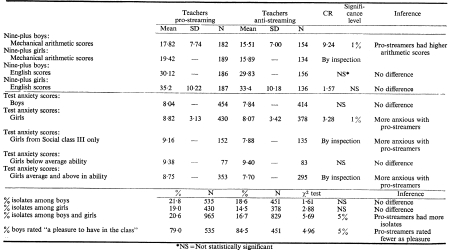 [click on the image for a larger version]
[page 580]
4.3 'Permissive' and 'Obsessional' Teachers
On the basis of extreme scores on the 'permissive'/'obsessional' scale, two very contrasting groups of teachers were selected from the pro- and anti-streaming groups. Thirteen highly 'permissive' anti-streamers were found and eight markedly 'obsessional' pro-streamers: between them they taught classes containing 326 children of nine and ten. The numbers are small and any differences have to be considerable to reach statistical significance. Table VIII summarises the results of the analyses which were made.
Table VIII
Teachers pro-streaming and also holding 'obsessional' attitudes, compared with teachers anti-streaming and 'permissive'
There were eight 'obsessional' teachers and thirteen 'permissive' teachers
| Obsessional,
pro-streaming | Permissive,
anti-streaming | CR | Signific-
cance
level | Inference |
| Mean | SD | N | Mean | SD | N |
| Test anxiety scores: boys | 8.40 | 3.58 | 129 | 7.84 | 3.33 | 231 | 1.48 | NS | No difference |
| Test anxiety scores: girls | 9.59 | 2.85 | 128 | 8.29 | 3.54 | 198 | 3.65 | 1% | More anxious with obsessionals |
| Number anxiety scores: boys | 7.20 | - | 129 | 7.39 | - | 231 | - | NS | No difference |
| % | N | % | N | X2 test | Signific-
cance
level | Inference |
| % isolates among boys | 26% | 140 | 16% | 252 | 5.07 | 5% | Obsessionals had more isolates |
| % of isolates among girls | 15.6% | 128 | 14.6% | 198 | - | NS | No difference |
| % of boys rated as disobedient | 28% | 140 | 17% | 252 | 5.88 | 2% | Obsessionals perceived more disobedience |
From this table, the generally greater test anxiety shown by girls again emerges and this time is even more clearly shown to have a relationship to the teacher's views and methods. More striking is the fact that the 'obsessionals' disapprove of 'bad manners' - aspects of behaviour more common among boys - which is reflected in their tendency to rate proportionally more
[page 581]
boys as difficult than do their 'permissive' colleagues. This in turn may go at least part way to explain why there are significantly more isolates among boys in their classes. It seems not unreasonable to suggest that the teachers probably manifest disapproval of certain boys and that this induces the class to reject them also.
One final, highly tentative hypothesis might be put forward. The 'permissive' teachers' classes did not achieve lower anxiety scores than those achieved in the anti-streaming teachers' classes generally - in fact the mean is slightly higher. This suggests that there may be a non-linear relationship between 'permissiveness' and anxiety, and that beyond a certain point of 'permissiveness', anxiety may in fact mount.
4.4 Conclusion
It must again be emphasised that in the nature of the data available, no very striking distinctions could be expected from the analyses of this section. It is the more interesting, therefore, that - particularly in the number of 'isolates' and in the test anxiety scores of girls - some fairly reliable differences have been found. The nature of these underlines the complexities of the problem under review and suggests that the more important and far reaching effects of streaming or non-streaming lie much less in formal attainments than in the human and personal aims of education. The emphasis, too, is shifted from the forms of organisation - the effects of which may be counteracted consciously or unconsciously by the teacher - to the teacher himself, his personality, views and attitudes, and consequent choice of methods. Organisation may perhaps facilitate or hinder the attainment of particular ends; the really important factor is undoubtedly the teacher who passes the whole day with an impressionable group of young children.
The following tables show the allocation to each stream of children having had six, seven, eight and nine terms of infant schooling.
Table IX
The length of infant schooling of children in different streams
Two-stream schools (23 schools, 6,390 children)
| A stream
% | B stream
% | Total
% |
| Six terms in infants' | 24.5 | 31.1 | 27.6 |
| Seven terms in infants' | 21.1 | 28.0 | 24.3 |
| Eight terms in infants' | 25.6 | 21.5 | 23.7 |
| Nine terms in infants' | 28.7 | 19.4 | 24.4 |
| TOTAL | 100 | 100 | 100 |
| Base | 3,422 | 2,968 | 6,390 |
[page 582]
Three and four-stream schools (19 schools, 7,778 children)
| A stream
% | B stream
% | C/D stream
% | Total
% |
| Six terms in infants' | 18.4 | 25.6 | 30.7 | 24.5 |
| Seven terms in infants' | 22.5 | 25.1 | 26.3 | 24.5 |
| Eight terms in infants' | 25.6 | 23.4 | 23.0 | 24.1 |
| Nine terms in infants' | 33.5 | 25.9 | 20.0 | 26.9 |
| TOTAL | 100 | 100 | 100 | 100 |
| Base | 2,865 | 2,569 | 2,344 | 7,778 |
There is a consistent trend for the A streams to have more children with nine terms infant schooling than would be expected by chance, and relatively fewer of those children who had spent a short time in the infants' school. For the lower streams, the trend is reversed. This tendency was found to persist even in the final school year: this accords with the low rate of transfer between streams that was noted in the survey report. The length of infants' schooling would appear to have had a lasting effect on the child's educational career, at least to the age of ten plus.
The differences between streams with regard to the length of infants' schooling are statistically highly significant (p<0.01) in both sizes of schools. It will be seen that the trend was more marked in the three and four stream schools. The remedial classes in the 100 school study, defined as 'the lowest stream combining two or more year groups and the E stream of the largest schools', showed the same tendency to a startling degree. Almost two fifths of the children in these classes had had only six terms infants' schooling. On the other hand, only 12 per cent with nine terms in the infants' school were found in a remedial class.
Table X
The length of infant schooling of children in remedial classes
| 6 terms
% | 7 terms
% | 8 terms
% | 9 terms
% | Total | Base |
| Remedial classes | 39% | 30% | 19% | 12% | 100% | 564 |
These results are in line with the findings of previous similar investigations. (1, 2, 3)
Some of the disadvantages of being a 'younger' child in a school year group might be removed if all children were allowed to start school at the same point in the year, thus removing the advantage of longer schooling which the 'older' child now has. It would be more logical for children to start school together at the beginning of the school year, since at every stage of the edu-
(1) JACKSON, B (1964) Streaming: an Education System in Miniature. London: Routledge and Kegan Paul.
(2) JINKS, PC (1964) An Investigation into the Effect of Date of Birth on Subsequent School Performance. Educational Research, Vol. VI, No.3.
(3) FREYMAN, R (1965) Further Evidence on the Effect of Date of Birth on Subsequent School Performance. Educational Research, Vol. VlII, No. 1.
[page 583]
cation system children born within the same year are treated as a unit (i.e. they move up the school together, take 11-plus at the same time, etc.). The fact that a quarter of the children in the sample had missed a full year's schooling as compared with their older classmates, does not seem compatible with the policy of treating them as one age group. A review of current practice may well be thought necessary.
5.5 Experience and Age of the Teacher
The teachers of the A-streams tended to have more experience - and consequently were older - than the teachers of other streams.
Table XI
Experience and age of the teacher
| Age of teacher | Years of experience |
| 2 streams | 3 or 4 streams | 2 streams | 3 or 4 streams |
| A | B | A | B | C/D | A | B | A | B | C/D |
| Bottom quartile | 35.0 | 27.2 | 30.9 | 29.3 | 27.2 | 10.9 | 5.2 | 9.8 | 6.5 | 4.8 |
| Median | 43.5 | 34.9 | 40.9 | 40.5 | 37.8 | 17.1 | 10.0 | 16.6 | 14.3 | 10.7 |
| Top quartile | 51.4 | 47.4 | 50.9 | 49.6 | 48.0 | 28.4 | 17.9 | 27.7 | 24.5 | 18.2 |
This tendency is in line with the observations made by Jackson (1) in the 10 streamed schools that he studied. There is also a tendency throughout the schools for younger children to be taught by younger and less experienced teachers.
5.6 Facilities in the classroom
The data available to us were analysed to see if there were any tendencies for anyone stream to be given classrooms with better facilities than the others (desks, lighting, noise, space). For the most part, any differences were not significant statistically. There were, however, two exceptions. In the three-stream schools, the lower streams were significantly favoured with regard to floor space (p<0.01). This accords with the observed tendency for lower stream classes to be smaller. It was also found that, in the three-streamed schools, the lower streams were placed in significantly less well-lit classrooms (p<0.05). There seems to be no more plausible explanation for this difference than that, where differential conditions exist, these tend to be allocated to the detriment of the lower streams. Most schools would have fairly uniform facilities, but enough schools would have relatively ill-lit classrooms facing north for their allocation to constitute a measurable tendency.
5.7 Changes of teachers
Taking all the year groups together, there was no significant tendency for some streams to have suffered more than others from changes of teacher during the year. When the total variables affecting the fourth year, however, were subjected to a complete analysis, a small but significant correlation (r = 0.247) was found between type of class and the number of changes of teacher. There was in fact a slight but positive association between low ability stream and change of teachers. The correlation for the first year children was not significant. More detailed work must be done before this point is completely clear.
(1) JACKSON, B (1964) Streaming: an Education System in Miniature. London: Routledge and Kegan Paul.
[page 584]
5.8 Teachers' Attitudes
In two-streamed schools, some tendencies were found which might indicate differences of attitude among teachers of different streams. Greater differences were found in schools with three or more streams, where there is probably a greater awareness of the fact that the school is streamed.
(1) In two-streamed schools, there were relatively more highly 'permissive' teachers in B streams than in A streams. No such differences were found in the larger streamed schools.
(2) In the larger streamed schools, there was a consistent trend for teachers of higher streams to favour 11-plus selection more than teachers of lower streams. In the two-stream school there was a less pronounced tendency for relatively more B stream than A stream teachers to disapprove of selection.
(3) Teachers of A streams in large schools were the group who disapproved most strongly of noise; there were no consistent differences between teachers of middle and lower streams.
(4) In two-streamed schools, a slightly higher proportion of B stream teachers favoured streaming than A stream teachers (45 per cent and 40 per cent). In larger schools, more A stream teachers were favourable (58 per cent) than middle stream teachers (42 per cent) or lowest stream teachers (32 per cent). This may suggest that the status-hierarchy of children and teachers is much more apparent in large streamed schools than in two-streamed schools.
(5) In all streamed schools there was a definite tendency for A stream teachers to be the most favourable towards A streams. Teachers of the lowest streams were the least favourable (but not nearly as unfavourable as the teachers in non-streamed schools).
Results (4) and (5) both show the same trends among teachers of different ability streams. Teachers of A streams tend to favour streaming and to perceive favourable qualities in A stream classes. Teachers of the lowest streams tend to be neutral in attitudes to streaming and less favourable towards A stream children.
SECTION 6
ATTITUDES OF PARENTS
(In co-operation with the Government Social Survey)
6.1 Introduction
In the course of a more extensive survey of parental opinion 224 parents of children in the schools included in the present study were interviewed in autumn 1964. They were the parents of selected children in their second year at four large junior schools, situated in Chester, Leicester, Wellingborough and Manchester. The children had been selected from the sample in such a way that a range of social classes and all levels of ability were represented. Two socio-economic categories were distinguished-UPPER (non-manual and skilled manual occupations) and LOWER (semi-skilled and non-skilled manual occupations). Five categories of pupils' ability were distinguished, as measured by the NFER Primary Verbal Test.
Two of these schools were streamed and two were entirely non-streamed.
The parents were interviewed in their homes by staff of the COI, using an extensive pre-coded interview schedule. The COI had included a number of questions which were relevant to the streaming project. These have been
[page 585]
analysed at the NFER, making use of our special information on the pupils, i.e. their streams, measured ability and parental occupation.
The findings which follow are tentative, since they are based on small samples, particularly when broken down into smaller sub-groups. Statistical tests have been applied where possible. These results should be interpreted with caution and regarded as providing suggestive rather than conclusive evidence.
6.2 Parents' knowledge of school organisation
Parents were asked: 'Do you know how the children of .....'s age are put into classes at (present school)? Are they put into classes by age, or do they put the quicker ones into one class and the slower ones into another?'
It was found that 85 per cent of parents of children in streamed schools could correctly identify the school organisation (i.e. streamed or non-streamed). In non-streamed schools, only 69 per cent of parents knew that streaming was not used; 17 per cent imagined that streaming by ability was used.
Table XII
Parents' knowledge of school organisation
| Percentage of parents believing that: | Streamed
schools
% | Non-streamed
schools
% |
| Children put in classes by age | 11 | 59 |
| Children put in classes by ability | 85 | 17 |
| Don't know | 4 | 14 |
| Some other method specified | - | 10 |
| Number giving information | 11 | 113 |
6.3 Parents' attitudes to streaming and non-streaming
Parents were then asked: 'For children of ...'s age, could you tell me which of these you think is better? For the quicker and slower children to be mixed together in one class, or for the quicker children to be put in one class and the slower in another?' The first alternative, of course, refers to non-streaming and the second to streaming.
Streaming was the more commonly chosen alternative. In the streamed schools it was chosen by 79 per cent of parents; in the non-streamed schools by 65 per cent. (Streamed and non-streamed schools differed significantly, x2 = 6.70, p<.01). There were six per cent of 'Don't knows' in each case. Less than one third of the parents of children in non-streamed schools approved of non-streaming.
Table XIII
Percentages of parents preferring streaming and non-streaming
| Streamed
schools
% | Non-streamed
schools
% |
| Prefer non-streaming | 15 | 29 |
| Prefer streaming | 79 | 65 |
| Don't know | 6 | 6 |
| TOTAL | 100 | 100 |
| Number giving information | 11 | 113 |
[page 586]
It seemed possible that parents in different social categories would differ in their attitudes. It was found, however, that this was not the case. The percentages preferring each method were almost identical.
Parents of B stream children appeared to be less favourable to streaming than either A stream or C stream parents; although this difference was not statistically significant (x2 = 5.67 p<.06). Table XIV shows that 28 per cent of B stream parents preferred non-streaming, as compared with an overall 15 per cent. The sample is rather small, however.
Table XIV
Percentages of parents preferring streaming and non-streaming (streamed schools only)
| A stream | B stream | C stream | Total |
| Prefer non-streaming | 4 (10%) | 10 (28%) | 3 (9%) | 17 (15%) |
| Prefer streaming | 35 (83%) | 26 (72%) | 27 (82%) | 88 (79%) |
| Don't know | 3 (7%) | - | 3 (9%) | 6 (6%) |
| Number giving information | 42 | 36 | 33 | 111 |
Next, a study was made of the attitudes of parents with children above average in ability, compared with those whose children were average and below. The cut-off point was taken as a standardised score of 105 on the primary verbal test. This made possible a comparison of parents' attitudes in streamed and non-streamed schools, regardless of the stream to which pupils had been allocated.
There appeared to be an association between the child's ability and his parents' attitudes to streaming. Parents of children with above average ability definitely tended to favour streaming; parents with less gifted children were much more likely to favour non-streaming. But even in the latter group, 'streamers' outnumbered 'non-streamers' by almost two to one.
Table XV
Percentages of parents preferring streaming and non-streaming - according to ability of child
| Streamed schools | Non-streamed schools |
| Child's test score | 105
or over | Less than
105 | Total | 105
or over | Less than
105 | Total |
| Prefer non-streaming | 3 (7%) | 14 (20%) | 17 (15 %) | 6 (17%) | 26 (34%) | 32 (28%) |
| Prefer streaming | 36 (88%) | 52 (74%) | 88 (79%) | 27 (75%) | 46 (60%) | 73 (65%) |
| Don'tknow | 2 (5%) | 4 (6%) | 6 (6%) | 3 (8%) | 5 (6%) | 8 (7%) |
| Number giving information | 41 | 70 | 111 | 36 | 77 | 113 |
[page 587]
The 49 parents who preferred non-streaming were asked: 'What do you think are the advantages of having the quicker and slower children mixed in one class?' The advantage most frequently mentioned was that it gives a sense of competition or spurs on the backward (this was mentioned by nine out of ten B stream parents who preferred non-streaming). Other advantages mentioned were that brighter children can help slower ones and that the feeling of differences between streams is avoided.
A similar question on advantages of streaming was put to the parents who preferred streaming. The percentages giving various responses are shown in Table XVI, with separate figures for A, B, C streams and for two levels of ability in non-streamed schools.
Table XVI
Perceived advantages of streaming by parents preferring streaming
| Streamed schools | Non-streamed schools |
| A | B | C | Total | 105
or over | Less than
105 | Total |
| Slow ones have more attention | 30 (86%) | 18 (69%) | 16 (59%) | 64 (73%) | 14 (52%) | 29 (63%) | 43 (59%) |
| Bright child not held back by slow children | 30 (86 %) | 13 (50%) | 15 (56%) | 58 (66%) | 21 (78%) | 22 (48%) | 43 (59%) |
| Slow children not made to feel slow or dunces | 18 (51%) | 8 (31%) | 7 (26%) | 33 (37%) | 4 (15%) | 9 (20%) | 13 (18%) |
| Easier for the teacher | 7 (20%) | 5 (19%) | 9 (33%) | 21 (24%) | 2 (7%) | 3 (7%) | 5 (7%) |
| Number giving response | 35 | 26 | 27 | 88 | 27 | 46 | 73 |
As Table XVI is based on the responses to an open-ended question, it is difficult to interpret the data. The numbers are small, but some trends deserve comment. In non-streamed schools, parents of bright children tended to mention mainly the advantage to the bright child, and parents of less bright children were more likely to mention advantages which would accrue to the slower child in a streamed class.
6.4 Parents' preferences for secondary schools
'If you had the choice, what type of secondary school would you like ... to go to when he/she is 11?' In reply to this question 40 per cent of all parents chose the grammar school. Twenty-four per cent either had not thought about it yet or did not mind (the children were eight years old). Sixteen per cent chose technical schools, 13 per cent secondary modern schools, four per cent comprehensive schools, and three per cent other schools. None of the four areas where this research was carried out had a comprehensive school.
When asked what they thought would be the advantages of the chosen type of schools for their child, those who chose grammar schools tended to mention that it would lead to a good or better job, had good future prospects, and that there was a better standard of education and teaching.
Technical schools were thought to lead to a good job and to have a varied, interesting or wide curriculum. Those who chose secondary modern schools tended to mention mainly the varied, interesting or wide curriculum.
Parents were also asked if there was any type of secondary school which they would particularly dislike their child to go to. Seventy-seven per cent had no dislikes. The numbers mentioning a dislike are very small; suffice it to say that coeducational schools were first on the list, and secondary modern schools were second. The commonest reasons given for disliking these schools were
[page 588]
that they contained rough, bad mannered or illiterate children and manifested bad discipline or behaviour or lax morals.
Let us now see how parents' choices were related to their children's abilities and to their socio-economic status.
In the sample, 35 per cent of children scored at or above 105 on the primary verbal test. A relatively high proportion of children from families in the upper social group obtained scores above 105, as compared with those in the lower social group. (See Table XVII below.)
Table XVII
Percentages of pupils in each social group scoring above and below 105 on the primary verbal test
| Upper
group
% | Lower
group
% | Total
% |
| Score of 105 or more | 40 | 28 | 33 |
| Score of 104 or less | 60 | 72 | 67 |
| TOTAL | 100 | 100 | 100 |
| Base | 89 | 134 | 223 |
The preferences of each of the four sub-groups were studied separately (see Table XVIII). Seventy per cent of the upper social group with bright children hoped for a grammar school, but so did 40 per cent of the upper group and 26 per cent of the lower group with less gifted children.
Evidence that social class influences to some extent the choice of school is seen in the table below. Sixteen per cent of parents of the lower social group with gifted children preferred the technical schools, which, while not chosen by parents in the upper group with bright children, were a popular choice among other parents.
The low proportion of parents actually choosing a secondary modern school bears no relation to the proportion whose children must eventually attend these schools. Again, choice of technical school was widely unrealistic when compared with availability.
Table XVIII
Percentages of parents choosing various types of secondary school
| Child's measured ability | Total
of all
parents |
| 105 or over | 104 or less |
| Parents' social group | Upper | Lower | Upper | Lower |
| Grammar school | 25 (70%) | 20 (53%) | 21 (40%) | 25 (26%) | 91 (41 %) |
| Secondary modern | - | 3 (8%) | 6 (11 %) | 21 (22%) | 30 (13%) |
| Comprehensive | 2 (6%) | - | 2 (4%) | 5 (5%) | 9 (4%) |
| Technical | 1 (2%) | 6 (16%) | 9 (17%) | 18 (19%) | 34 (15%) |
| Independent | - | - | - | - | - |
| Hadn't thought, don't mind | 6 (16%) | 9 (21 %) | 14 (25 %) | 25 (26%) | 54 (24%) |
| Others | 2 (6%) | - | 1 (2%) | 2 (2%) | 5 (3%) |
| Number giving information | 36 | 38 | 53 | 96 | 223 |
[page 589]
SUMMARY OF RESULTS
1. Streamed and non-streamed schools embody different philosophies (paragraph 2.8).
The streamed school seems to be more systematic in its approach, concentrates more on conventional lessons, gives more attention to the 3Rs and is likely to be more 'traditional'. Its staff is likely to be somewhat older and more experienced, to approve of A stream children, of 11-plus selection and of streaming. The non-streamed schools present an apparent contrast. Its younger teachers hold more 'permissive' views on such things as manners, noise and cleanliness; they disapprove of streaming and A streams, and 11-plus procedures. Their teaching tends to place more emphasis on self-expression, learning by discovery and practical experience.
Although different patterns emerge for streamed and non-streamed schools, not all teachers in each type conform to the predominant pattern. A minority in each type of school holds the views and opinions usually expressed by teachers in the other type of school.
Any effect which may be shown to be associated with streaming or non-streaming is unlikely to be purely and simply due to the form of organisation used. Attitudes of teachers and their teaching methods may well be the critical factors.
2. A straight comparison between streamed and non-streamed schools showed that pupils in the streamed schools had slightly higher mean scores on the attainment tests (NB But see conclusion, paragraph 3.4). The differences were greater the more the test reflected 'traditional' educational practices; they were largest for mechanical arithmetic and smallest for reading. It may happen when the effects of teachers' attitudes and beliefs are examined, that differences between the two types of school will disappear altogether. Or that they may become larger. The differences may also disappear when the two types of school are controlled for social class.
3. A study of two contrasting groups of teachers, supporters of streaming and supporters of non-streaming, was made in non-streamed schools. What can be discerned at this stage is that the teachers' attitudes are just as important or perhaps even more important than the type of school organisation. The teachers in non-streamed schools, believing in streaming, obtained a higher level of arithmetic computation from their pupils, while those believing in non-streaming had fewer social isolates in the class, caused less anxiety about tests and found more of their pupils a pleasure to have in the class. (Paragraph 4.4.)
4. A study was made of the characteristics of pupils allocated to, and teachers taking, the different ability streams in streamed schools. Month of birth and length of infants' schooling had a lasting effect on the educational career of children in streamed schools. (This effect is being examined in non-streamed schools.)
A steady decline in average age was seen as one proceeded from the A streams to the lower streams. Also, children in lower streams, especially in remedial classes, tended to have had a shorter period in the infants' school. (Paragraph 5.4.)
[page 590]
A-streams tended to have the more experienced and, consequently, older teachers than other streams (paragraph 5.5). A stream teachers (in three or four-stream schools) were more in favour of streaming than teachers of other streams. (Paragraph 5.8.)
5. From a study of a small sample of parents of pupils in the two types of school, it was found that the majority of parents preferred streaming to non-streaming. (Paragraph 6.3.)
Of the parents who had a preference for a secondary school, the majority preferred their child to go to a grammar school. (Paragraph 6.4.)
ANNEX 1
Details of matched pairs of schools
Initially, 50 matched pairs were selected. By the time that all the tests and questionnaires had been completed, a number of schools had changed their organisation in some way which made them unrepresentative of streaming or non-streaming. They were therefore excluded from the analysis and it became necessary to rematch the remaining schools. This operation resulted in 42 matched pairs, giving a total of 84 schools for the cross-sectional study. It will be appreciated that when a number of pairs had lost one member, rematching would not produce pairs which were as good as the original ones. An effort has been made to obtain the best possible pairs, either by rematching or by elimination of schools which could not be rematched.
Criteria for matching schools
(a) Type of school: Junior or junior-with-infants; urban or rural. (All the schools were non-denominational and all were situated in England.) The results of matching on this criterion are shown in the table below.
| Streamed
schools | Non-streamed
schools | Total |
| Junior, urban | 37 | 37 | 74 |
| Junior, rural | 1 | 1 | 2 |
| Junior-with-infants, urban | 4 | 4 | 8 |
| TOTAL | 42 | 42 | 84 |
(b) Number of classes in the school. All the schools had at least eight junior classes. The two members of a matched pair could differ in size by a maximum of one class.
The 42 streamed schools had a total of 437 classes;
The 42 non-streamed had a total of 434 classes.
(c) Average number of pupils per class. Matched schools had approximately equal pupil/teacher ratios. A margin of +/- 3 pupils was tolerated.
The average number of pupils per class were:
In streamed schools: 35.90 (standard deviation 6.27)
In non-streamed schools: 35.25 (standard deviation 4.89)
The difference was not statistically significant (C.R. = 1.8). The greater standard deviation in the streamed schools was due to the tendency for A-streams to be larger than C-streams.
[page 591]
(d) Geographical region: North, Midlands, South. The two members of a matched pair were both located in the same region. The numbers of schools in each region were:
| North | 29 |
| Midlands | 31 |
| South | 24 |
| TOTAL | 84 |
(e) Percentage of children in the local authority who attended non-selective schools. It was felt that the forces tending to make a school concentrate on 'preparing for the 11-plus' might be related to the proportion of children admitted to selective schools. We therefore matched the schools on this criterion, allowing a margin of +/- 5 per cent.
(f) Predominant socio-economic status of parents. The head teachers were asked to estimate the percentage of parents in each of five categories: professional, clerical, skilled, semi-skilled, unskilled. This information was used to form four main categories of schools. All but three pairs of matched schools were both drawn from the same category, the number of schools in each being:
| Upper working class (over 50 per cent of fathers were in the skilled category or over 50 per cent were in the clerical and skilled categories combined) | 19 |
| Middle working class (over 50 per cent of fathers were in the skilled and semi-skilled categories combined) | 33 |
| Lower working class (over 50 per cent of fathers were in the semiskilled category or in the unskilled category or over 50 per cent were in the semi-skilled and unskilled categories combined) | 24 |
| No dominant social group (schools which did not fit into any of the above categories) | 8 |
| TOTAL | 84 |
(g) Approximate matching of percentage of parents in professional, clerical and skilled occupations. As a further precaution, matching of schools was effected within each of these socio-economic categories. The members of a pair resembled one another, both having either more or less than 10 per cent of professional parents, 20 per cent of parents in the clerical category, and 20 per cent in the category of skilled workers. This was based on the head teacher's estimate. At a later date, information, given by class teachers, for each individual child was obtained. The table below is based on the latter, more accurate information. The streamed schools in the sample were from a slightly higher socio-economic background.
Table XIX
Percentage of children in each socio-economic category, according to type of school organisation
| Socio-economic categories | Total |
| 1 | 2 | 3 | 4 | 5 |
| Children in 42 streamed schools | 7.4 | 12.8 | 35.7 | 29.2 | 14.9 | 100 |
| Children in 42 non-streamed schools | 5.5 | 12.2 | 33.7 | 34.6 | 14.1 | 100 |
[page 592]
ANNEX 2
TEST RELIABILITIES
Reliabilities of tests, calculated by the Kuder-Richardson Formula 20
| Test | Junior
year
group | Reliability | Reliability
sample
size |
| Reading, version SRA | 1 | 0.942 | 99 |
| (48 items) | 2 | 0.949 | 96 |
| 3 | 0.945 | 100 |
| 4 | 0.943 | 98 |
| All | 0.961 | 393 |
| Reading, version SRB | 1 | 0.942 | 104 |
| (48 items) | 2 | 0.927 | 102 |
| 3 | 0.929 | 106 |
| 4 | 0.929 | 108 |
| All | 0.951 | 420 |
| Problem arithmetic, version SPA | 1 | 0.877 | 100 |
| (30 items) | 2 | 0.903 | 98 |
| 3 | 0.916 | 98 |
| 4 | 0.914 | 100 |
| All | 0.942 | 396 |
| Problem arithmetic, version SPB | 1 | 0.904 | 94 |
| (30 items) | 2 | 0.921 | 98 |
| 3 | 0.917 | 100 |
| 4 | 0.931 | 106 |
| All | 0.950 | 398 |
| Mechanical arithmetic, version SMA | 1 | 0.890 | 94 |
| (35 items) | 2 | 0.924 | 94 |
| 3 | 0.935 | 100 |
| 4 | 0.919 | 94 |
| All | 0.948 | 382 |
| Mechanical arithmetic, version SMB | 1 | 0.883 | 100 |
| (35 items) | 2 | 0.925 | 100 |
| 3 | 0.939 | 106 |
| 4 | 0.927 | 100 |
| All | 0.950 | 406 |
| English, version SEA | 1 | 0.960 | 88 |
| (64 items) | 2 | 0.966 | 82 |
| 3 | 0.957 | 86 |
| 4 | 0.965 | 86 |
| All | 0.974 | 342 |
| English, version SEB | 1 | 0.966 | 100 |
| (64 items) | 2 | 0.971 | 102 |
| 3 | 0.968 | 110 |
| 4 | 0.960 | 110 |
| All | 0.977 | 422 |
| Primary verbal I (85 items) | 3 and 4 | 0.970 | 330 |
| Verbal/Non-verbal (80 items) | 4 | 0.940 | 363 |
| ABC, general anxiety, scale A (15 items) | 3 and 4 | 0.718 | 220 |
| ABC, test anxiety, scale B (15 items) | 3 and 4 | 0.712 | 220 |
| ABC, number anxiety, scale C (15 items) | 3 and 4 | 0.829 | 220 |
[page 593]
ANNEX 3
TEACHERS' ATTITUDES
Reproducibilities of Guttman Scales for Teachers' Attitudes (Questionnaire S.3)
These were calculated according to the formula proposed by Guttman. (See SA Stouffer et al. Measurement and Prediction, Princeton, 1950. Page 117.) Values obtained from two separate random samples of 100 teachers are given; also the minimal marginal reproducibilities (MMR), the number of items in each scale, and the number of trichotomous items.
| Scale | Title | Reproducibility | MMR | No.
of
items | No. of
tricho-
tomies |
Sample
1 | Sample
2 |
| A | Permissive-obsessional | 0.944 | 0.942 | 0.73 | 5 | 0 |
| B | Attitude to physical punishment | 0.955 | 0.953 | 0.78 | 6 | 0 |
| D | Attitude to 11-plus selection | 0.952 | 0.942 | 0.81 | 5 | 1 |
| G | Attitude to noise in the classroom | 0.932 | 0.926 | 0.74 | 5 | 0 |
| H | Attitude to streaming | 0.950 | 0.952 | 0.76 | 6 | 1 |
| I | Attitude to A streams | 0.936 | 0.942 | 0.75 | 5 | 1 |
Teachers' attitudes - Questionnaire S.3
1. Streaming makes slow children feel inferior.
2. There is too much emphasis on cutting down noise in schools.
3. A stream children have wider interests than other children, both inside and outside school.
4. I think a good slap in the right place at the right time does an awful lot of good.
5. Children in A streams tend to become conceited about their abilities.
6. Children must be taught to have decent manners.
7. I don't mind a reasonably high working noise in my class.
8. Bright children should not be streamed off from the rest of their age group.
9. The 11-plus exam is an entirely fair method of assessing a child's abilities.
10. Children in A streams worry too much about marks.
11. Physical punishment does no good at all to any child.
12. Bright children deserve a special academic course in a separate school when they are 11 years old.
13. An occasional hard slap does children no harm.
14. I cannot stand children fidgeting in class.
15. It is socially wrong to segregate children into streams.
16. The 11-plus exam can prevent slackness in junior schools and this is a good thing.
17. Teachers should demand clean hands in school.
18. I would not allow talking in a class of 35 or more children.
19. The bright children will be neglected in non-streamed classes.
[page 594]
20. Naturalness is more important than good manners in juniors.
21. An 11-plus exam is more fair than relying on record cards and teachers' assessments.
22. If children in my class are insolent, they have to be slapped.
23. Opportunities for self-expression through movement, painting and writing poetry, are more important than concentrating on the 'three Rs'.
24. In a streamed school, one gets far more done for the slow learner.
25. I'm quite prepared to spank bottoms for disobeying rules.
26. The atmosphere in A streams is too competitive.
27. Nothing worthwhile will be achieved by a class that talks while it works.
28. Non-streaming would be impossible with large classes of 40 or more.
29. Any exam that segregates children into separate schools at 11-plus is undesirable.
30. Physical punishment is out of the question and completely unnecessary.
31. A quiet atmosphere is the one best suited for all school work.
32. Without streaming, neither the bright nor the dull get the best from what the school could offer.
33. With non-streaming, I would find it impossible to keep duller children occupied while bright children received attention.
[page 595]
APPENDIX 12
GYPSIES AND EDUCATION
This note was prepared at the Council's request by Mrs B Adams of the Sociological Research Section, Ministry of Housing and Local Government and Mr DM Smith, Lecturer in Education, City of Leicester College of Education, who have made a study of gypsies in the course of their work for the Ministry of Housing and Local Government. It is reproduced here because, although the group of children involved is too small to justify a discussion of this length in the body of our Report, the children's educational needs are nevertheless extreme and largely unmet. Moreover the economic and social handicaps of the group from which they come arise to a large extent from the fact that successive generations of gypsy children are deprived of the education that would enable them to compete on equal terms with the rest of the community. Extreme as they are, the needs of gypsy children cannot be effectively met by measures of the kind we recommend for the more general problems of urban deprivation. They will require special attention and carefully planned action. At the same time, the numbers of children involved are so small that we believe a relatively small expenditure of money and effort, not confined only to the educational services, could rapidly achieve long steps towards a solution of the problems described in this Appendix.
GYPSIES AND EDUCATION
by Mrs B Adams, Sociological Research Section, Ministry of Housing and Local Government and Mr DM Smith, Lecturer in Education, City of Leicester College of Education
1. There seems little doubt that the so-called gypsy is a descendant of members of certain wandering Indian tribes: Romany vocabulary is related to languages still spoken in northern India and traditional gypsy occupations - fortune telling, horse dealing, music, dancing, wood carving, smithery - stem from those of low-caste Indian tribes. These nomads were first noted in European countries in the fourteenth and fifteenth centuries. When they arrived in England they travelled with pack horses and lived in tents and it was not until the late eighteenth century that they adopted the covered living wagon. At first they travelled in large bands causing consternation among the settled population and repressive legislation was enacted against them, starting in 1530, which treated them as felons. Present day legislation is less repressive but the 1959 Highways Act, the Caravan Sites and Control of Development Act 1960, and various private Acts are used by local authorities to discourage gypsies in their area.
2. Few steps have been taken to investigate the living conditions of gypsies in England and Wales. Kent Planning Authority carried out a county enquiry in 1951 which has since been followed by other counties. The investigation by the Ministry of Housing and Local Government has involved three stages.
[page 596]
On March 22, 1965, when most families were still in their winter quarters, a census was undertaken by the counties and county boroughs. Later in the year a survey of the sites reported in use was carried out, and a few sites were investigated in detail.
3. The census was not limited to 'true gypsies' or people with Romany blood and it is important to know the criteria adopted in the definition. The persons covered were so-called gypsies and other travelling people living in caravans, huts or tents, usually isolated from the settled community. Although called 'travellers', some have not left their base camp for some time. They usually make a living by dealing in scrap metal, cars, rags and other commodities, doing seasonal agricultural work, log and firewood cutting, casual labouring, hawking and begging, and they rarely take a regular job. Not included in the census were gypsies living in houses, showmen, tramps, boat dwellers and caravan dwellers on residential sites who were typically part of the settled community.
4. It is estimated from the census that the gypsy population of England and Wales is at least 15,000 (1) persons or about 3,400 families. The gypsies were widely scattered in almost every county and in one local authority area in three. The largest concentrations were found in the following counties:
| Families | Persons |
| [Kent* | 325 | 1,363] |
| Worcester | 197 | 866 |
| Essex | 164 | 853 |
| Surrey | 146 | 674 |
| Staffordshire | 109 | 446 |
| Buckinghamshire | 109 | 421 |
| Gloucestershire | 104 | 405 |
| Cornwall | 100 | 451 |
| Hertfordshire | 98 | 481 |
| Herefordshire | 96 | 459 |
| Berkshire | 85 | 414 |
5. On the day of the enquiry only 19 per cent of the families were camping on licensed or local authority sites; the rest were camping haphazardly on agricultural land, roadside verges, commons, woodlands, quarries and even on refuse tips. The facilities found to be provided were minimal and the majority of families were using stopping places with no facilities whatever. Only 33 per cent had access to running water and 35 per cent to refuse disposal facilities. Twenty-four per cent had hardstandings and 18 per cent electricity. Only 16 per cent of families had access to a water closet on their site. Conditions were generally better on the handful of sites provided by Local Authorities.
6. In the south of England the typical horse-drawn gypsy caravan and the tent have almost gone out of use though in Yorkshire and Humberside in March 1965 over a quarter of the families still lived in this type of accommodation. The trailer caravan is now the most usual dwelling. Caravans are sometimes overcrowded but some of the better off families own extremely large modern caravans with two or three apartments or have two caravans.
*Kent had carried out a survey on 1 January 1965 and the county was therefore excluded from the census. Figures for Kent for 1 January are included in the national total.
[page 597]
7. Moving from place to place is still an integral part of the life of most of these families. Approximately 60 per cent reported that they had travelled around in the preceding year and there are reasons for thinking that this is an underestimate. In March 1965 57 per cent had been on their camp site for six months or less, 21 per cent for less than a week. Travelling mainly occurs in the summer months - all but the most hardy families prefer to stay in one place for the winter, though they are not always able to do so. Twenty-six per cent of the gypsy population said they did not travel: the elderly tend to give up wandering and settle in one spot. The belief that travelling is largely economically motivated was confirmed by the census, for the majority of household heads said they had moved in search of agricultural work or other means of earning a living. However, in many cases movement was involuntary and due to the difficulty of finding a stopping place. Many of the traditional gypsy stopping places on the outskirts of towns have been closed to them since the war, in many cases by development, but in other cases by fencing, tipping or ditching to prevent access.
8. More than half of the men were dealers, mainly in scrap metal. Much of this involves house to house or factory to factory collecting, so that when supplies in one town are exhausted a move to the next is necessary. The second most important occupation was agricultural work which is seasonal and also necessitates moving from place to place. Other occupations mentioned frequently were roadwork, building work, and other labouring. Only two per cent of the men did factory work. Among the women, less than a third said that they went out to work, the largest group being hawkers. The proportion of women under 35 following this occupation was only half that among women over 65 which suggests that hawking is dying out. The relatively narrow range of occupations found among the travelling people reflects not only their traditional crafts and their unwillingness to work for others but also the fact that the vast majority are illiterate and thus unfitted for many occupations.
9. The age distribution of gypsies differs markedly from that of the total population of England and Wales in being abnormally young. It bears a marked resemblance to the age structure of the total population of the country in 1841. The age structure of the Eire tinkers is similar.†
| Age | Gypsies*
% | Total population of
England and Wales (1965)
% |
| 0 - 4 | 16.7 | 8.7 |
| 5 - 15 | 24.6 | 15.8 |
| 16 - 34 | 30.6 | 25.0 |
| 35 - 44 | 11.6 | 13.3 |
| 45 - 64 | 13.1 | 24.9 |
| 65+ | 3.4 | 12.3 |
| 100 | 100 |
†Report of the Commission on Itinerancy. Dublin 1963.
*Excluding the Kent gypsies, for whom age data was not collected.
[page 598]
10. Including an estimate for Kent, the number of children under 16 in March 1965 was over 6,000 and two households out of three contained children under 16. The high birth rate among gypsies is reflected in the proportion of children - twice the national figure for 0-4s and half as much again for the 5-15s. A forward projection of the 1965 gypsy population to 1985 suggests that the number of children is likely to double in the twenty year period.
11. The census and the site enquiry were designed solely to provide a basis for policy decisions on accommodation for gypsies. No questions on education were asked. Our information on education is therefore derived from personal experience of gypsies over many years and upon the detailed investigation of a few sites.
12. Before the war the gypsies were virtually unanimous in considering education a waste of time, harmful to health and to be avoided. Little attempt seems to have been made by the authorities at that time to get gypsy children into school.
13. This situation has not changed greatly, though some gypsy parents, probably a majority, do now want their children to go to school. Other parents had brief and unpleasant experiences at school and are determined to protect their children from similar ones. Since the majority of families still travel, staying either from choice or necessity for relatively short periods in each place, normal education is not feasible. Our evidence suggests that less than ten per cent of the children of school age are attending school: the great majority are growing up illiterate. Some of the children who attend school do so only during the winter months when they are settled in winter quarters. There is often a conflict between the permissive attitude of primary schools, where children are usually encouraged to expand their speech and develop initiative in exploring and understanding their environment, and the child's restrictive family background.
14. Most children spend all their time in the family group and kinship bonds are particularly strong. The children are usually indulged and corporal punishment is rare. During the early months of life some children are carried by the mother when she goes hawking. Older children are left behind at the camp when the mother goes out, primarily in the care of the oldest girl and under the supervision of the other women in the extended family group. The children rarely wander from the camp and there is little or no mixing with house-dwelling children. Play tends to be non-projective and often destructive in conclusion. The increasing ownership of television sets may beneficially broaden the children's experience.
15. The children are quick to acquire certain skills. In the past they early became expert with horses or at making clothes pegs. Now, children unable to tell their right hand from their left can recognise and separate copper and alloy from base metal. Many are adept at handling money. In some families the older boys go out with their fathers collecting scrap metal and many do a full day's manual work from the age of 12 or 13.
16. As the family is almost the only socialising agency experienced by the gypsy child in its formative years, this restrictive situation, with relatively few stimulating experiences, tends to inhibit intellectual growth. A study by
[page 599]
Gordon (1923)* using mental and arithmetical tests showed a significant decline in mental ability with advancing chronological age in a group of gypsy children who occasionally attended school. The following figures from limited studies by students of Avery Hill College of Education give some indication of the possible intellectual growth through educational opportunity of gypsy children.
| Age | Comprehension | IQ |
| Gypsy children 12 months at school (1953) |
| Boy A | 10.6 | 67 | 74 |
| Boy B | 11.3 | 65- | 66 |
| Girl A | 11.3 | 65- | 71 |
| Gypsy children with six years at school (1963) |
| Boy A | 10.8 | 85 | 89 |
| Girl A | 11.5 | 94 | 84 |
| Girl B | 10.10 | 81 | 83 |
17. In 1964 Leicester City Council set up a site for itinerant families at Lodge Farm, a large area of derelict land adjacent to the city refuse tips, about 2.5 miles from the city centre and some three hundred yards from the nearest house. Elsan toilets and a refuse disposal service were provided, and water was delivered daily to the site. Itinerant families from several sites in the city were directed to Lodge Farm and at the beginning of 1965 there were over 30 families on the site. In some families none of the children had ever attended school, in others some of the children had attended school but not for any continuous period. While at Lodge Farm, no children attended school. The numbers on the site increased to over 60 families, but the site was closed in the autumn of 1965. Many families moved from Lodge Farm to a traditional stopping place at Anstey Gorse and in January 1966 none of the 37 (approx.) children of school age on Anstey Gorse was attending school. Four Irish tinker families had attempted to enrol their children at a local Catholic school but the waiting list was genuinely over-subscribed. All families have now been moved off Anstey Gorse; no alternative site has been provided.
18. Last year Godstone RDC [Rural District Council] set up a site for gypsies and other caravan dwellers. The site has a tarmacadam road, concrete paths and hardstandings. Each pitch has a water standpipe, small shed and dustbin. There are shared toilets, ablutions block with showers, laundry room with hot water, and a washing machine. There is a resident warden, himself of travelling stock. The children can get a special bus to the local primary school where 50 per cent of the children are from the camp site. There are no special classes for gypsy children but they are sometimes given special coaching in groups. Attendance is not regular and at the slightest excuse they are absent. The headmaster reported that, without the normal home background of play and vocabulary, schooling was very difficult for the children. He is pressing for more equipment for backward children. Although there is no noticeable separation in classes, in the playground the camp children often tire of a game quickly and tend to be withdrawn. It is interesting that the higher up the school the children get, the more their appearance approximates to that of the other children.
*H Gordon. Mental and Scholastic Tests among Retarded Children. Education Pamphlet No. 44, 1923.
[page 600]
19. South-East Buckinghamshire has traditionally accommodated considerable numbers of settled or partly settled gypsy families and at the two teacher village school at Horton several gypsy children of the second generation are now being educated. The staff are sympathetic and the school has a strong craft element. One result of the number of gypsy children in the school has been a prejudice against the school on the part of some house-dwellers. The gypsy children are wholly integrated in the two classes and to the casual visitor are indistinguishable from house-dwellers. The teachers reported that on arrival gypsy children were very withdrawn and some did not speak for three months. They appeared to understand brief verbal communications but not long sentences. However, it was usual for them to be able to read by the age of seven. One child has passed the preliminary test for the eleven plus, but this was exceptional and in most cases attainment is below average. Poor verbal ability persists, perhaps because few of their parents can read or write.
20. A successful attempt at settlement has been made by Eton RDC who in 1964 set up a site at Iver for 32 travelling families with local ties. Each family has a fenced pitch with hardstanding and a brick storage shed. There are parking lots for lorries and rough grazing for ponies. Standpipes, WCs, laundries, and hot water supply are shared. The resident warden is a responsible gypsy, related to many of the residents. The standards and aspirations of the residents have risen notably since they moved on to the site and now all the children of school age are in school. They are usually taken to and from school by lorry. At the Parlaunt School at Langley, the children were originally kept in a single group in the care of a 'helper' closely supervised by the headmistress. This was unsuccessful and the children were then integrated into normal classes, with several in a small remedial class. On arrival their environmental handicap was very evident: many had never used a pencil or a knife and fork and all had a very limited vocabulary. They were clean but oddly dressed. They have gradually become more interested in school work and do not stay away as much now as they did. Though they are still backward, all are making progress and there have been one or two striking successes. Most of the teachers consider the camp children to be of low intellectual capacity but the teacher of the remedial class considers that by the age of 10 or 11 some will overcome their environmental handicap and show average performances. The parents are cooperative, increasingly interested in the school, and say they are anxious for their children to be educated. Nevertheless, some take them away for Ascot week and for several months during the summer when the family goes pea picking, fruit picking and potato lifting.
Conclusion
21. Of the 6,000 gypsy children in England only a small minority is attending school. These are the children living a relatively settled existence, a considerable proportion on sites provided by local authorities. Even when attending school regularly these children have to contend with a severe environmental handicap. The number of gypsy children is likely to double in the next twenty years.
In 1962 the Ministry of Housing and Local Government issued a circular urging authorities to establish sites for gypsies, but the response has been disappointing. A further circular giving the findings of the 1965 inquiry and calling for proposals for the establishment of sites is about to be issued.
[page 601]
APPENDIX 13
THE MANAGEMENT OF PRIMARY SCHOOLS: RESEARCH UNIT ON SCHOOL MANAGEMENT AND GOVERNMENT, UNIVERSITY OF LONDON, INSTITUTE OF EDUCATION
This Appendix is a preliminary report prepared for the Council by the Research Unit on School Management and Government, University of London Institute of Education. It is the first part of a more extensive study and is based mainly on the views of and information from chief education officers*. The views of teachers, managers and representatives of parental and other organisations will be sought later. Nevertheless it has helped us considerably in our study of factors affecting the status of primary education (See Vol. 1, Chapter 29). We are grateful to the Unit for making this Report at our request, particularly since they originally intended to concentrate on secondary school government.
*'Chief education officer' is used throughout this Report although some chief officers are called Director of Education, Education Officer or Secretary for Education.
[page 602]
Primary School Management: Preliminary Report submitted to the Central Advisory Council for Education (England) by the Research Unit on School Management and Government, University of London Institute of Education.
(Head of Unit: Dr G Baron)
This memorandum has been prepared and written by Mr DA Howell, Research Officer to the Unit.
Introduction
1. The Unit's research has been concerned principally with matters relating to the government of county secondary schools but, following discussions with the Department of Education and Science and representatives of the Central Advisory Council, it was agreed that the Unit should submit what evidence it could relating to county primary school management.
2. Over the last few months visits have been paid to some seventy local education authorities. The purpose of the visits has been to discuss general questions of school management and government with Chief Education Officers and members of their departments, and the staff of the Unit have also had opportunities of studying relevant documents, such as instruments and rules of management, school bulletins, handbooks for managers and governors. It is on the basis of information gained in this way that this memorandum has been compiled.
3. We are very much aware of the limitations of this preliminary report. In particular, restrictions on time have made it impossible to discuss the main issues or to check information with head and assistant teachers or with managers. And we have not included studies of the management of voluntary, controlled and aided schools whose opportunities and problems differ substantially from those of county and county borough schools. We think, however, that the information and opinions given by over two hundred administrative officers concerned with school management reflects closely the 'reality' of the situation in which they work.
4. The Authorities visited to date comprise 25 County Boroughs, 18 of the Outer London Boroughs, and 27 County Councils. The County Boroughs and the Counties cannot be regarded as completely representative, but they form at least a substantial proportion of the whole. Most of the County Boroughs visited are among those with a population of 150,000 or over, but we have also visited a number of smaller boroughs. The conclusions which we draw relating to school management practice in County Boroughs may well be liable to modification if we should find that the Authorities which we have not visited (that is principally the smaller County Boroughs) display different patterns. It is unlikely, however, that any completely new arrangements will be discovered. The County Councils include most of the larger Authorities, some medium-sized counties, and a few of the smaller ones. Some of the Counties visited are administered completely through a system of Divisional Executives, others have a mixed system of administration, while yet others have no system of delegation to subordinate authorities.
5. We considered it essential to discuss our findings relating to County Councils and County Boroughs separately. It is clear that geographical facts
[page 603]
alone have played a considerable part in shaping overall administrative structures, and especially the school management patterns. In the County Boroughs many matters can be referred quickly and directly to the administrative branch concerned, and in more senses than one schools are nearer the Authority. It is easy for someone from the Education Office to look in at the school, or for the Headmaster to visit the Office. This point has clearly influenced the evaluation of school management in such Authorities. Great stress is laid on providing links between individual schools and members of the Education Committee, and still more with the Education Office. Relatively little importance is attached to establishing a link between the school and the local community through the recruitment of school managers who are not primarily, or to any great extent, local politicians.
County Boroughs
6. Arrangements for school management in the County Boroughs visited vary as follows:
| A Sub-committee for all schools | 16 authorities |
| B Grouped bodies including secondary schools | 3 authorities |
| C Grouped bodies for primary schools only | 5 authorities |
| D Separate managing bodies | 1 authority |
Notes
1. Group A includes one Authority with grouped bodies recruited entirely from members of the Education Committee, and one Authority which operated a pilot scheme of grouped managing bodies.
2. Five Authorities in category A appoint members of the primary schools sub-committee as visitors to individual schools.
3. The Authority in category D adopts the practice of appointing one of the managers as clerk or correspondent.
County Boroughs with one managing body for all schools
7. In the Local Authorities where the sub-committee serves as the managing body for all schools, it is held that a system of separate or grouped managing bodies would be purposeless. Where the need for managing bodies is not dismissed out of hand, it is argued that the paramount need is not so much to strengthen links between school and the local community, as to ensure that schools have direct access to individual members of the Education Committee, and to the Education Office. More than one CEO has said that he makes a point of visiting all the primary schools from time to time, or at least ensuring that his senior officers do. In roughly half these Authorities we are told that there is some system of visiting schools by individual Councillors, and although a few CEOs think this a useless activity, the majority consider that it has many advantages. It enables Councillors to get to know their schools and to deal with local inquiries and complaints. Evidence of interest on the part of the Committee improves the morale of the school, and it enables Councillors to identify themselves with the individual schools. This is said to be particularly true where a Councillor visits one or more schools in his ward, and it is said that many schools are very proud of their Council visitor. It is also claimed that this arrangement enables a Headmaster to let off steam to a sympathetic and influential listener, but it is thought less likely that Heads will discuss their general ideas and plans for running the school, as they can so easily have informed discussions with the 'Office' about such matters.
[page 604]
8. The sub-committee system often seems to be associated with the view, not uncommon in municipal government, that only elected members should be entrusted with responsibility for public institutions. We have heard claims that if elected members of the Education Committee did not form a majority on school managing bodies this would reflect a gross abdication of responsibility on their part, as non-elected members were irresponsible and might easily take embarrassing decisions. The same arguments are used to justify the sub-committee system, on the grounds that only in this way can elected members of the Borough Council, who could not attend meetings of separate or even grouped managing bodies, carry out the practice of managers. Further, and somewhat illogically, managers' meetings are not given high priority as managers have little or nothing of importance to discuss. Indeed, in some Authorities we have found that the meetings of the primary schools sub-committee are sometimes cancelled through lack of business, and elsewhere last only five or ten minutes. One or two Authorities have tried both a single sub-committee and a system of grouped managing bodies. One Authority, which replaced its grouped managing bodies by a sub-committee, felt that it could even dispense with appointing individual visitors to schools. A large Authority, which for two years ran the pilot scheme mentioned above, decided that results did not justify extending it. It is not uncommonly felt in these Authorities that managers are an unnecessary extra tier in the administrative structure, and that the requests of the schools can be dealt with expeditiously by normal administrative and committee procedure. Moreover, reference of requests to bodies meeting only once a term would be quite out of the question, and the CEO and his staff are generally available anyway to discuss any general or particular question which a Head wishes to raise. It is said, further, that in these Authorities Heads have become used to the system and that they do not agitate for separate managing bodies, and that since some of these Authorities operate a closed shop system for the appointment of primary school Heads many have known no other system of school management. It is also claimed that primary Heads are less demanding than their secondary colleagues and much more inclined to take things in their stride. One Authority thinks that it has achieved a successful balance between administrative efficiency and individual interest in the schools with its system of school visitors, who are all members of the Education Committee. This visiting is taken very seriously. Heads use their visitors as sounding boards for their ideas and difficulties, and they can be asked, particularly if they are Councillors, to give a gentle prod to the Education Office. Since some of these visitors are Councillors and known locally as public persons, it is claimed that parents are not at all reluctant to approach them on any matter affecting their school, and that through their interest in the school visitors are able to perform a genuine public relations or ambassadorial function.
9. The effectiveness of this system in linking individual schools with the Education Committee and the Office was said by one CEO to be more suitable for the smaller and more compact Authorities, although he claimed that a grouped system would be better for the larger Authorities. However, in the largest County Boroughs visited we found that all except one had a sub-committee system. It was one of these Authorities which had carried out the pilot scheme referred to above, but in his report on this scheme the CEO
[page 605]
said that he could discern no benefits for the schools which had been included. He claimed that the Councillors really knew the schools and were points of reference for Heads and parents, and that they would take up the Head's grumbles with the Education Office. However, this was clearly not true in another large Authority which had a sub-committee system with visitors, where all newly appointed Heads were advised that they were not to take complaints about delays or other administrative matters to their visitor. Finally, it is generally considered in the large County Boroughs that the institution of a small grouped system would result in a top heavy organisation involving considerable administrative cost with no apparent result.
County Boroughs with grouped managing bodies
10. The minority of County Boroughs visited (9) have a more highly developed system of school management. Of these, five have grouped bodies, responsible for from three to 12 schools (counting a junior and infant school on the same site as one school), three have joint bodies for primary and secondary schools, and there is one County Borough with separate managing bodies, each with one of the managers acting as clerk. In this last authority, it is said that with more than 90 primary schools it would be an impossible administrative burden for the staff of the Education Office to undertake clerking (although the number of administrative officers presumably bears some relationship to the size of the system). In general these Authorities think that they have evolved a satisfactory system with roughly the right number of schools in each group; they make the same claim as the Authorities operating a sub-committee system, that it enables a balance to be maintained between administrative efficiency and local interest and identification with individual schools. One Authority, which had tried a number of experiments, thought that there should not be more than six schools in a group. Another Authority claimed that the Heads did not mind being dealt with in larger groups, and that in fact they looked forward to their group meetings; they even regarded the waiting room as a sort of club.
11. In these Authorities the formal status of managing bodies for primary schools, as measured by provisions of the rules of management, was generally similar with that of the Authority's governing bodies for secondary schools; some six out of eight Authorities provided for the submission of estimates by individual bodies of managers, seven had identical arrangements for the appointment of Heads of primary and secondary schools, and seven again provided that in both primary and secondary schools the managers should have the general oversight of the school and its curriculum. In practice, however, these provisions are frequently dead letters. There seems to be general agreement that it is out of the question to prepare estimates for each primary school, while with regard to the general oversight of the school and its curriculum the managers are solely dependent on the Head and what he chooses to put in his report. We have not found that Heads' reports lead to managers' indulging in what the CEO or Heads regard as interference; in fact, managers tend to be inhibited about voicing views on any matters relating to the school curriculum. Three of these Authorities have provision for parents to serve on managing bodies, generally through parent/teacher associations, and in another parents are said to be appointed often. One
[page 606]
Borough advertises in the local press for prospective managers and claims that it gets four or five applicants for every vacancy.
12. In this group of Authorities there are mixed feelings about managing bodies. It is maintained that those prepared to serve are not of high quality, that Heads find them of small help or, indeed, have little need to make use of them, or that they do not know how to deal with their managers as individuals, that operating this kind of system can mean a great deal of virtually pointless work, and that most Heads would be glad to see it ended. Yet in spite of these disadvantages, the same Authorities admit that this system is better than having one managing body for all schools. One Authority, which had changed to a grouped system, said that under a sub-committee system only the most vociferous Head had anything to say. Heads think that, under a grouped system, managers can give them more powerful support and that Councillors, especially women, enjoy their direct contact with schools. In one Borough a more positive claim is made that managers can be particularly helpful in strengthening the schools' links with the community outside. In this Authority, however, it is felt that managers are a waste of time because the town is compact and the Education Committee and the Office are in regular touch with the schools. The grouped system of school management is felt to be an over-elaborate way of establishing public relations agencies to represent the schools. Local Councillors are said to do this much better, since they are more liable to be buttonholed or harassed by the public than other managers who may be quite unknown persons. Except in the Borough which advertised for managers it is often said that it is difficult to recruit suitable people, especially in the more socially depressed areas. As far as the appointment of parents on managing bodies is concerned, there appear to be no strong feelings in general, apart from a suggestion that their interest may be too transient and subjective. In a majority of this group, all managers are appointed through party political channels, but the operation of the party system is considered to be one of the facts of life in urban local government and one which does not necessarily have pernicious effects. Political control of nominations need not depress the quality of school managers, although it is claimed that some would-be managers of good calibre are deterred from offering their services through reluctance to make themselves acceptable to one party or another. In politically marginal Boroughs it is said that there has to be a fair amount of give and take between parties in the appointment of managers. It is held everywhere that despite party interest in the appointment of managers, the matters discussed at their meetings are not such as to give rise to any great political dissensions.
13. There is recognition, albeit reluctant and qualified, that managers may have some residual function, either as a safeguard against apparently arbitrary action by the Head or the Education Office, or as a group of friends of the school. However, only in one Authority is it claimed that Heads are glad to share the responsibility of appointing staff with their managers, or at least with the Chairman. Most CEOs in County Boroughs have a noticeable lack of enthusiasm for school management, and even where a grouped system exists few positive advantages are claimed for it. The same basic attitude is apparent in the steps taken by the Outer London Boroughs to inaugurate efficient systems of school management and government. Here,
[page 607]
apart from their sole administrative function of the appointment of Heads, and occasionally Deputy Heads, where they follow the practice of the Boroughs with a grouped system, managers are said to perform a rôle in supporting the morale of the school and its Head, in giving it a civic status through their appearance on the platform at speech day and other occasions, and in providing a means of greater contact between members of the Education Committee and the schools. As elsewhere, the success with which these functions are performed depends on the amount of time which managers are prepared to devote to the job. In general, however, the Outer London Boroughs have not yet considered the implications of their assessments of school management (half the Boroughs visited have a grouped system and half a sub-committee system) and this low priority itself appears to be an indication of the general lack of interest in this aspect of educational administration.
COUNTIES
Policy
14. The situation is quite different in the counties. The sheer physical distance of some individual schools from the County or Divisional Education Office tends to reinforce the case for having a body of lay support for each individual school. Indeed, we found a virtual unanimity of view in favour of school managers, and in particular of separate managing bodies wherever possible. This consensus may be highly significant since visits have been paid to a wide range of Counties, thickly and thinly populated, small and large, and of varying degrees of administrative and social complexity. A number of CEOs have been emphatic that the need to have machinery for lay participation in education, and the considerations relevant to school management in villages and small towns, also apply in large measure to urban areas. They see no overwhelming reason for believing that County Boroughs and Counties have entirely different problems which it is useless to consider in the light of the same assumptions, although they are not unaware of the grounds upon which some County Boroughs reject this point of view. This insistence on the need for local participation is held particularly strongly in the more urban counties. The basic difference between the attitudes found in the two types of Authority is that the County Boroughs see a justification for school management (where they have any true system at all) in providing a direct link between the Education Committee and the schools, while Counties think that the need is to provide a link between the school and the community. Some counties are very explicit about their priorities, and have taken much more trouble than others to work out a school management scheme based on a coherent philosophy.
15. Almost all counties claim that single managing bodies are their ideal. This is said to be inevitable in rural areas, although even there grouping is not entirely unknown, and in one extreme case we have found one managing body serving no fewer than 21 schools. (This managing body was almost a divisional executive in its own right, serving a very compact and isolated area, with visiting sub-committees to ensure a greater interest in individual schools). Where grouping for management purposes does take place it is said to be the result of traditional or historical practices. On the whole it is
[page 608]
heartily disliked and some CEOs have succeeded in establishing individual managing bodies even in fair sized towns. However, in other counties, CEOs feel that they have to accept some measure of grouping, particularly where this is the wish of a large or expanding minor Authority. Indeed, most Counties are prepared to give some weight to the views of local councils on grouping policy, especially where these are former Part III Authorities. Excepted Districts virtually go their own way, even if this involves doing what the County regards as undesirable. In some cases grouping policy is associated with the arrangements for clerking managing bodies of which we will have more to say later.
Recruitment
16. Statutory practice in recruiting school managers is for the local Authority to nominate four members and the minor Authority two, for schools in areas administered directly by a County and serving the needs of one minor Authority only. When a school caters for more than one minor Authority, nominations will be made on a proportionate basis, and in Counties with a divisional system of administration the divisional executive will make nominations for two places elsewhere held by the LEA. These LEA nominations are invariably made through local County Councillors or locally resident aldermen, who are presumed to be in touch with suitable candidates. There is some suggestion that minor Authorities tend to nominate from the ranks of their own members, and to be reluctant to consider the claims of other local residents who might have a contribution to make. Some of these minor Authorities have sought to unseat managers in mid-term if they fail to hold their seats on the local council; in these cases the Local Education Authority has had to intervene, pointing out that whatever happens to the composition of the local council, managers are there to serve their statutory term. A number of CEOs expressed their concern about the numbers of elderly managers, and their apparent lack of interest in education. Nominations from County Councillors, and from minor Authorities, are often scrutinised by the Education Committee, which may have to take a formal vote on disputed appointments. Only one County of those so far visited asks for details of prospective managers' interest in education, and goes to the point of referring the nominations back, if candidates do not seem to be suitably qualified. There is said to be no general lack of people to stand, except in a few isolated areas. Both in solid working class and middle class areas people are 'falling over themselves' to serve. The shortage of potential managers, so often remarked upon in County Boroughs, does not appear to be a problem in the Counties. In a few cases nominations are put forward by the CEO himself, who may come across suitable people in his travels around the county. One CEO who did this said that it was undemocratic but effective. He was able to hand-pick people with a positive contribution to make, and thus to produce managers of better than average calibre. Counties where the CEO takes some initiative in suggesting nominations are among the less political Authorities, but in other Counties nomination can be a live political issue and is left strictly to councillors and local politicians. It is often claimed that local vicars are very much to the fore on managing bodies, especially in villages, and that they are sometimes inclined to run the school too much on their own, having to be reminded from time
[page 609]
to time that County schools are not the same as voluntary schools. Occasionally, would-be managers offer their services to the Chief Education Officer and in this event they are usually advised to approach their local County Councillor.
17. All Authorities were asked how desirable they thought it was to have parents on managing bodies. Four Counties have some specific provision to this effect, three of them obtaining nominations from parent/teacher associations, but only one County goes to the other extreme and expressly forbids parents to serve on the managing body of their child's school (in this Authority, a strictly constitutional view was taken that parents should voice their complaints and queries either to the Head direct or to their elected representatives); elsewhere it was reported that parents are commonly found on managing bodies and that it is almost impossible to avoid this in villages. In those Authorities where there is no formal provision for parental membership, the view is often expressed that interested groups should not be directly represented as such, and that parents should serve, like other managers, as individuals. The balance of opinion is clearly in favour of having parents serving as managers. In some Authorities, parents are regarded with enthusiasm, and efforts are made to ensure that each managing body has one or more serving on it; others give a more qualified welcome, and a few have serious reservations, generally on the grounds that parents' interest is biased and transient, and too dependent on what their child tells them, while in one case it is claimed that appointment of a representative of a PTA produces the most trying relationships. However, in spite of their shortcomings, most CEOs think that parents are at least more in touch with the school's basic problems than most other managers, who may have had little experience or acquaintance with local authority schools. Parents are also younger than most other managers and can produce a generally livelier discussion. It would be true to say that parenthood is often regarded as a good qualification for school managers.
Clerking
18. There are divergent views on arrangements for clerking managing bodies, and on the merits of official versus local clerking systems. Similar counties may opt for entirely opposite arrangements. Some scattered rural counties, for example, have all primary schools clerked from the Education Office, while other much more compact Authorities attach importance to one of the managers acting as clerk. A number of Counties have hybrid systems; for example, a Divisional Officer clerks schools in his area, while a manager or other local person acts as clerk in the directly administered areas of the County. Here the CEO can assess the advantages of both systems. In nine counties schools are clerked either from County Hall or from a Divisional Office. In two other Counties all schools are clerked, in principle, from County Hall, the county taking over local clerkships as these fall vacant through death, removal or resignation. Two Counties have hybrid systems and nine rely wholly or mainly on local correspondents. The arguments for central clerking are that it keeps the managers in touch with County Hall and enables authoritative answers to be given to their queries at meetings. It ensures that managing bodies meet, and is good training for the administrative
[page 610]
assistants in the Education Department who are sometimes used for this work. Local clerks may be unbusinesslike or, at the other extreme, legalistic, and the extra administrative cost may be justified by the wider needs of the county's administration as a whole. In favour of local clerking it is claimed that the administrative burden of official clerking would be enormous, and would not be worthwhile, since managers have very little business to transact. In contrast to the argument that it provides officials with good administrative training and an insight into the work of schools, it is dismissed as an 'awful grind', and one which is wasteful of the time of high level staff. It is also said to inhibit managers' discussions and to detract from their independence if they have a man from the Office present at the meeting, whose function is perceived as being to tell them what they cannot have. One County tries to meet the acknowledged disadvantages of local clerking by giving newly appointed managers some guidance on the preparation of agenda and minutes, and on means of keeping in touch with the LEA. In a number of areas a modest honorarium is paid to local clerks and this is thought to remind them sufficiently of their responsibilities to the county. Even those Authorities which are in favour of local clerking agree that it is not easy to keep track of every managing body in the County and that there may well be cases where managers do not hold their statutory terminal meetings. Indeed, some managing bodies had not met for one or two years and one was said not to have met for ten. One Divisional Officer who clerked personally all meetings of managing bodies in his area argued that there was no point in having a meeting for its own sake, and that if he had too many schools to clerk, there should be fewer meetings rather than more office staff. Some CEOs try to ensure that they themselves or a senior member of their staff visits all managing bodies occasionally, whether as of right or by invitation. In other Counties local clerks and correspondents consult the education office as a matter of form on the preparation of the agenda or on the taking of subsequent action. The limitations of having a completely amateur clerk can be avoided if, as happens in at least one County, members of the County Education Department act as school clerks, paid or unpaid, in their spare time. CEOs with experience of both systems tend to prefer professional clerking in spite of the increased administrative costs. One CEO mentioned that professional clerking does not cost much more than local clerking, especially if the latter system depends on an unbusinesslike clerk with whom correspondence over the simplest item can be protracted. Careful planning may mean that a clerk can attend two or three managing bodies in a day, even in the more scattered Counties, and deal with a number of other matters at the schools. Central clerking is said to be very successful if the representative of the Chief Education Officer regards himself at the meeting as clerk to the managers, rather than as an emissary from the Education Department, and advises them accordingly. We have spoken to a number of school clerks about the problems produced by these dual claims on their loyalties, and without exception they think that they can adapt themselves to the situation. This consideration, of course, applies just as much to school managers, who sit on County Education Committees, or indeed to anyone who sits on a parent body and one or more of its subsidiaries. There would seem to be scope for some investigation into the costs of introducing a central system. It may well be true that many local Authorities are understaffed professionally, and that if three or four additional
[page 611]
professional staff were recruited this might benefit County Education Departments generally as well as improving the arrangements for school management. On the whole we think that the arguments for professional clerking are strong, in view of the importance of seeing that managers meet once a term both to transact any necessary business, and to take a wider interest in the life of the school. This is not 'meeting for the sake of meeting'.
Managers and Divisional Executives
19. Reservations on the usefulness of managers have come from the CEOs of some counties with schemes of divisional administration where there is said to be much duplication in the membership of managing bodies and divisional executives. In these cases managers may be nothing more than the fifth wheel on the coach, and in some extreme cases it has been maintained that the same people are found discussing the same issues five times (that is, at a managers' meeting, Divisional Executive Sub-Committee, Divisional Executive, County Education Sub-Committees, and County Education Committee). We have not as yet collected sufficient evidence to justify a substantial discussion on the relationship of managing bodies to Divisional Executives. However, we have found that CEOs are more inclined in general to argue against Divisional Executives than against managing bodies on the grounds that the focus of local interest should be the school and that its links with the community should be strengthened. It may be of interest to note that we have come across one county where Divisional Executives have been rejected in favour of area committees consisting only of local Education Committee members and meeting once a quarter, and another County which scrapped its area committees, but developed greater powers on managing bodies and increased minor Authority representation on them. At this stage we can say only that it is essential to consider the future of managing bodies in relation to the future of local government areas and functions as a whole.
Formal Powers
20. Why then should managers meet? We can consider this question by reference to the formal powers which managers possess, and the functions which they perform. If we look first at managers' formal powers, there does not seem to be any overwhelming justification for their existence. In comparison with governing bodies, managing bodies may seem at times to be very small beer, and even a comparative study of formal provisions in the rules and articles of government and management provides some evidence of their lower status. For example:
| 1. | A | Counties having identical procedures for appointment of Heads in primary and secondary schools | 7 |
| B | Counties with identical procedures, except for the operation of a promotion list for primary heads | 7 |
| C | Counties with procedures giving a smaller part to managers (e.g. appointment to be made by LEA subject to consultation with managers) | 13 |
| 2. | A | Preparation of estimates by individual managing bodies | 3 |
| B | No reference to preparation by individual managing bodies | 24 |
| 3. | A | Authorities where managers have 'general oversight of the school and its curriculum' | 5 (+2 doubtful) |
| B | Authorities where reference to 'curriculum' is deleted | 20 |
[page 612]
21. In practice the formal powers mentioned are limited by centralised procedures resulting from staffing shortages, central budgeting and bulk ordering procedures, the introduction of capitation systems, and the need to determine building programmes on an overall basis. Initial teaching appointments are generally made centrally by LEAs, and assistant teachers and non-teaching staff are often appointed solely by the Head with, at most, the chairman of managers present. Managers are left with some share in the appointment of a headmaster, the occasional appointment of non-teaching staff, approval of school lettings, occasional closures, minor repairs and the approval of special requests by the Head for furniture and equipment as their administrative functions. While these relatively trivial matters may leave the managers some little say in running a school, they do not amount to a great deal. The most important function is that of appointing a head, but it occurs so infrequently that of itself it could not justify the existence of managing bodies. Even so, it is worthwhile taking a closer look at CEOs' assessments of managers' share in appointing heads. On the whole they give their managers a qualified welcome. For example, we are told that managers may be both effective judges of personality and safeguards against the appointment of 'yesmen'. As representatives of the community they can be concerned, in varying degrees of effectiveness, to see that the right headmaster for a particular school is appointed, but they cannot, unlike the LEA representatives on the Selection Committee, be regarded in any sense as experts in interviewing. There are said to be some dangers of nepotism and of managers' playing safe. In some areas managers are said not to have the faintest idea how to interview, or to conduct themselves at meetings, even though they take their duties seriously. But if they give a unanimous vote - although this cannot always be guaranteed - this ensures that a newly appointed Head has some local backing.
22. Many of the other powers formally given to managers seem to belong to the days of the school boards, and even where they are not totally irrelevant to present day needs, they do not add up to a real job of work. Examples are rules of management which provide for managers to inspect stock books and registers and to ensure that the school-keeper [caretaker] exercises due economy in the use of fuel and cleaning materials. It can hardly be a matter of surprise if managers complain about being frustrated, although they never seem to suggest any concrete extra powers which they might have, and they rarely carry their frustration to the point of resigning.
Informal Aspects
23. It may be more profitable to ask about the influences which managers exert, and the extent to which they act as ambassadors or public relations agents on behalf of their school. This aspect of their work is not emphasised in most rules of management, and this lack is particularly important when the rules and instruments are all which most LEAs ever give their managers by way of guidance. Some CEOs have admitted that they might do more to develop informal aspects of managers' work, or to show them where they stand in relation to the administrative system as a whole. Five of the counties we have visited issue handbooks. Some of these are written especially for managers, while others are intended mainly for Heads, with a special introduction emphasising how managers can show a general interest in the schools'
[page 613]
work in between their terminal [termly] meetings. These handbooks are said to be greatly appreciated. They certainly appear likely to give managers many excellent ideas on ways in which they can make a positive contribution to the work of the school. Two LEAs hold conferences for groups of managers, and the CEOs have been so enthusiastic about these that it is worth quoting from our reports in some detail:
24. In Authority A, the Chief Education Officer felt strongly the danger of individual managers not having contact with the Authority and its officers. He thought there was a need for means by which chairmen of committees and he himself might meet managers informally to discuss plans and grievances, and to improve their interest in and information on local schools. He thought that the right kind of background would be provided by an exhibition of schools' work, where those concerned could meet for an afternoon and compare notes over tea. The system of conferences that resulted, and which have been held now for ten years, seems to have paid off. With six or seven groups of primary schools meeting at a time it takes three years to cover the county.
25. In Authority B, meetings of all managers were held after the triennial elections. This gave new managers a considerable amount of informal guidance, and old managers a chance of keeping up to date. The CEO said that the event was welcomed by managers, and that this was borne out by the attendance figures. Meetings were held at a school which would be especially interesting to managers, for example, a school for handicapped children, or a new comprehensive school. In the morning the managers would listen to two or three speakers, break for lunch, and in the afternoon there would be a question and answer session. The speakers would talk on matters of general educational interest. The CEO in his talk might incorporate some hints on minor administrative detail (for example, the inadvisability of sending an omnibus letter on more than one subject to county hall, as this could cause difficulties and was likely to lead to delay). It was hoped that the morning talks would spark off questions for the afternoon session, answered by a panel which included the CEO, the Chairman of the Education Committee, and two Heads: such questions might even include such explosive issues as 'How does one sack a Head?' It was thought that this conference added to the good feeling which existed between the Committee and the managers, and gave managers a chance to discuss their mutual interests and difficulties.
26. Another County issues a special bulletin to managers and governors on general educational matters twice a year, while a few others let the clerks to managing bodies see the monthly schools bulletins sent to Heads which are concerned mainly with current administrative detail.
In one County a newsletter is sent to managers by the Divisional Officers. We are told that this trouble is amply repaid, and produces keener managers who are much better informed on current developments, and able to discuss problems wider than those affecting their own school.
Relations with Heads and the public
27. CEOs have been unanimous in telling us that in most cases relations between Heads and their managers are smooth and harmonious. There is the occasional domineering chairman, but there is generally great respect among managers for the headmaster, and most cases of disharmony are said to be
[page 614]
the fault of the Authority, or of the Head who will not make the special effort needed to gain his managers' confidence. Some Heads tend to be rightly suspicious of their managers - in one CEOs words 'Some of them can be quite awful' - while on the other hand, there is said to be a small minority of heads who do not appreciate the importance of carrying their managers with them. Failure to establish good relations with managers can have damaging consequences, particularly in rural areas. CEOs think that the dangers of managers overstepping the mark and trespassing on the Head's professional preserves are much exaggerated. Managers are far more likely to be inhibited from asking questions relating to the curriculum, and, like their colleagues in the boroughs, to be dependent for their interest on the contents of the Head's report. When reports are full and forthcoming, and include mention of a school's shortcomings, they lead to constructive discussion, and not, as might be feared, to interference in the day to day running of the school on the part of the managers. There is bound to be some ambivalence in the attitude of CEOs when considering managers' general interest in the school and the Head's professional autonomy and status, and this is reflected in the varying extent to which CEOs expect to consult their chairman over 'crisis' issues, for example such matters as food poisoning arising from schools' meals, the introduction of sex education, and outbreaks of bullying. While it is assumed that Heads should be able to solve most of their schools' problems on their own, CEOs agree that they would be most misguided not to consult their chairman, at least with the intention of informing him of the action they propose to take. Heads can get out of touch with public feeling, and the presence of an effective and interested body of managers can help to overcome this. We are told that some village managers go to great time and trouble to give their Head useful and intelligent backing, that they can be helpful in introducing a new Head to the village, and that they can bring about a remarkably effective relationship between the parents and the school. It is not thought likely that all members of one managing body will be narrow-minded, and particularly where the Head is in a difficult school or an unreceptive area they can be a great source of encouragement to him. Heads who live in the village schoolhouse are sometimes at the mercy of angry fathers, and glad to have the managers on their side, while if the Head does not live in the village and act as its general factotum, there is said to be a greater need still for the managers to act as his eyes and ears. Even if managers are not very penetrating they often see things from the point of view of the sensible parent, which is of great benefit to both the school and the education office.
28. CEOs of County Authorities are equally emphatic on the importance of managers' ambassadorial functions. We find this unanimity most impressive, particularly as it seems to be shared by their staff who are in everyday contact with managers. We do not think we have been presented with a remote and idealised view, as CEOs have been very ready to talk about managers' shortcomings, examples of which have been quoted. One or two CEOs say explicitly that these aspects of schools management are equally important in the towns although, as we have seen, their colleagues in the County Boroughs are, for the most part, not equally concerned. It would have been easy for CEOs to content themselves with vague assertions of managers' usefulness, but we have come across numbers of instances where managers have justified
[page 615]
their existence ten times over, in spite of the doubtful administrative case for managing bodies. We are told that, in times of rapid change, managers can be a most potent force in presenting educational problems to the public. Service as managers has completely altered many people's attitudes to education and local administration, and they have in many cases been successful advocates of the needs of their school within the county's system of broad priorities. While they may not know much about education, they are often shrewd and active in public life and able to use their experience to the benefit of the school. They act as a first court of reference over major discipline problems. Parents are happy in knowing that local residents are involved with the school, and that managers can bring the Divisional Officer's attention to matters affecting their own children. The charge that managers can occasionally be awkward is not an argument against them, as the LEA has to guard against the danger of complacency, and should be happy to welcome suggestions or criticisms from any quarter. This stress on the importance of managers is found equally in all sorts and sizes of County. One interesting regional difference appears to be that in the north there is a greater willingness for managers to concern themselves with the welfare of individual children, in addition to that of the school as a whole. Managers will, for example, have an informal word with difficult parents, or go behind the scenes to concern themselves with the needs of deprived children. This concern may be seen as a valuable legacy of previous hard times, but it is only fair to say that the opinion was expressed in other Authorities that Education Welfare Officers or Child Care Officers should be able to cope with these individual problems.
Conclusion
29. The data and views collected so far need to be treated with some considerable caution. They form only about a third, and possibly not a fully representative third, of the first stage of our research. Had we spent the last few months interviewing Heads or managers, or sitting in on meetings of managing bodies, we might now be presenting a markedly different picture. We do not, therefore, consider that we can draw more than entirely tentative conclusions at the present stage, but we think that the information and the assessments we have heard have been based on more than hearsay or second-hand evidence. Everywhere we have interviewed the staff of Education Departments directly concerned with school management, where the CEO has not handled this himself. Some CEOs have expounded their philosophy of school management in considerable detail, and we have been able in some places to discover how far current practice is formed by the CEO or the chairman of the Education Committee. In some LEAs we have been confronted by a number of officers who have not been slow to disagree among themselves on almost any aspect of school management. These disagreements have been most illuminating. As the interviews have progressed, we have been better able to exploit the most promising questions, and in general we think that we have succeeded in getting CEOs and their staff to ventilate their views on every important facet of school management.
30. It is quite clear that County Borough and County CEOs look at school management in entirely different lights. Up to a point, this is an inevitable consequence of geographical differences, and even of different Committee
[page 616]
systems. In the Counties, with Committee meetings held at longer intervals and with many schools at a considerable distance from their administrative centres, there must perforce be more delegation to the individual school. The approval by the Department of Education and Science of schemes of school government which provide for large groups, with a majority of Education Committee members on the governing body, appears at least to suggest official acquiescence in the prevailing County Borough philosophy. It would seem to apply even more forcibly to managing bodies in the Boroughs. Local Authorities here are, of course, following what is allowed to them by the Education Act, 1944. It may be said that if a school has its individual visitor it is given some sort of status even when forming part of a grouped system of school management, and arguments against individual managing bodies or bodies with small groups are almost universal in the Boroughs. But is this the whole of the story? Some County CEOs do not accept this, and they consider that the need to establish links between the school and the community is just as urgent in urban areas. This would seem to be supported by the minority of County Boroughs which has a working system of school management with small groups, if not with individual managing bodies.
31. Much has been made of the argument that administrative cost would prevent the establishment of more highly developed systems of school managements in the Boroughs. We think that this argument needs to be scrutinised closely, and it might also be worthwhile considering the possibility of using a manager to act as clerk, as is already done on one Borough Authority.
[page 617]
APPENDIX 14
NOTES ON VARIATION IN LEA PROVISION*
by BP Davies, Lecturer in Social Administration
London School of Economics and Political Science
A. PRIMARY SCHOOL EDUCATION AND THE STUDENT YIELD OF SECONDARY SCHOOLS
1. It is in some ways useful to compare the education system with an industry which has a variety of 'inputs', a number of stages, and a wide range of 'outputs'. Ideally, questions of resource allocation should be settled by calculating what combination of 'inputs' would most effectively produce the required 'output' of people of various attributes, given the technical coefficients of the production function, the relative prices of inputs and limitations or their supply. This analogy is of limited use in practice, however. There is no easy way of deciding the educational outputs required, since not only is the relative importance of different uses of outputs a controversial matter but also technical aids to judgement about the need for outputs for these uses are as yet primitive, and yield results which are unreliable. Too little is known about how inputs could best be combined to produce a given output, unless one defines output in a way that is no more than a description of the inputs. Many of the most important inputs and standards are difficult to measure. Others could be measured quite easily, but central and local authorities have not thought it worthwhile to do so. Thus variation in the rate of turnover of teachers or the number of secondary schools without science labs or library rooms are not recorded although the data exists for both and merely requires analysis and although the importance of both was emphasised in the Newsom Report.
2. There are very few indices of the final and intermediate output of the local authority education system. One can make rough estimates of the final output of school leavers at various ages. This is not an adequate measure of output since it takes no account of the quality of the school leavers. One cannot classify them by the number of 'O' Level, 'A' Level, ONC, HNC, CISE and other passes in various subjects groups obtained for instance.† It is unfortunate that we lack indices of educational success for all types of pupils, since American studies (and British experience) have shown that systems that are relatively successful with the bright children are not necessarily those which are successful with others.‡ Since practically the only output indices suitable
*Limitations of space prevent a full statement of the results of the analysis of the 100 or so standards indices, but a fuller analysis is to be published elsewhere. See BLEDDYN DAVIES Social Needs and Resources in Local Services, London, 1967; and a forthcoming Occasional Paper in Social administration.
†The regional figures for numbers of 'O' and 'A' levels gained are based on a sample which is too small to give accurate results for individual authorities. They could perhaps be used to measure the output of individual authorities if results for several years were added together.
‡See SM GOODMAN The Assessment of School Quality, New York, 1959.
[page 618]
Table 1
Coefficients of Variation‡ of Indices of Provision of Primary and Secondary Education (1961-62)
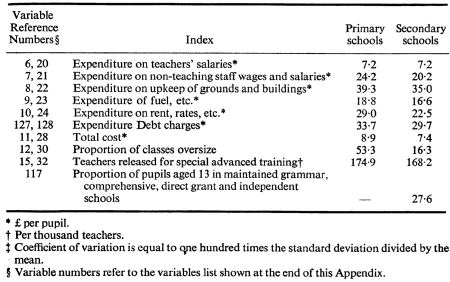 [click on the image for a larger version]
Table 2
Correlation of Indices of Standards of Provision of Primary and Secondary School Education and Output Indices, 1961-1962
[click on the image for a larger version]
Table 2
Correlation of Indices of Standards of Provision of Primary and Secondary School Education and Output Indices, 1961-1962
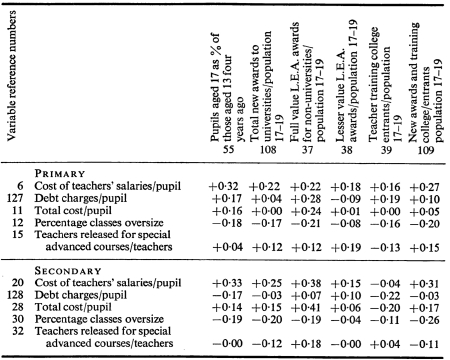 [click on the image for a larger version]
[page 619]
for analysis measure the intermediate output of the system entering higher education, this note concentrates on them.
3. At first sight, it might seem that variations in standards - i.e., variations in the quantities and quality of inputs - of primary school systems might have considerable influence on the intermediate output of secondary schools going on to higher education, and the final output of pupils leaving during or after a sixth form course. One reason for this is that standards of provision of primary education are more unequally distributed than most aspects of standards of provision of secondary schools. This is shown in Table 1, which uses coefficients of variation.* None of the coefficients of variation for secondary schools exceeded the coefficients for the equivalent indices for primary schools and for most indices the difference between coefficient values was substantial. However the proportion of pupils aged 13 in non-selective and selective schools was more unequally distributed than other important indices of secondary school provision.
4. The correlation coefficients measuring the degree of association between certain indices of primary school provision and indices of output shown in Table 2 might also imply that variations in important standards of provision of primary schools might cause difference in output.† Thus expenditure on teachers' salaries per pupil was clearly correlated with the proportion of the cohort staying on until their 17th year, the proportion receiving awards for universities and, to a lesser extent, the proportion receiving lesser-value awards (to other branches of higher education) and the proportion entering training colleges, although the coefficients are not high. Similarly total expenditure per pupil was correlated with the proportion receiving awards for universities, and the proportion staying on. But the degree of correlation between the indices of provision of primary education and the most important output indices was generally smaller than that between the indices of primary education and the equivalent indices of secondary education. Thus expenditure per pupil on teachers' salaries in the two types of school were correlated +0.37, expenditure per pupil on debt charges (reflecting the proportion of school places new) were correlated +0.22 and total expenditure per pupil were correlated +0.36. The proportion of classes oversize in the two types of school were correlated +0.18. The equivalent indices of provision of secondary education were in general more highly correlated with the output indices than were the indices of primary education, as is shown in the bottom part of Table 2. Thus it is likely that the direct effect of the variation in standards of provision of primary education on these outputs indices is small. Multiple regres-
*The Coefficient of Variation is used to measure the degree of inequality of indices. The coefficient measures the relative dispersion of the scatter of readings around the mean of the readings. It is independent of the units in which the index is stated, but it can be misleading if the distribution of readings is very skewed or if the relative values of index readings in relation to zero is arbitrary.
†The correlation coefficient is used to describe the degree of association between variables. It measures the degree to which readings which are greater or less than the mean of one variable tend to be associated with readings which are greater or less than the mean of the other variables. If high readings in one variable tend to be accompanied by high readings in the other, the sign of the coefficient is positive, while if high readings in one tend to be accompanied by low readings in the other, the sign is negative. The highest value a coefficient can take is +1.00 or -1.00, and the lowest reading 0.00. The coefficient understates the degree of correlation if the association is non-linear.
[page 620]
sion analyses of the output indices on standards and socio-economic characteristics of areas support this conclusion.*
5. These results imply that it would be possible to have a slightly different pattern of variation in standards of provision between local education authority areas without affecting the pattern of variation of output of students from each authority. The pattern of variation in the yield of students, people likely to join what some have called the 'clerisy' [academics], is unlikely to be affected by the small change in the pattern of variations in standards which could be achieved without a very considerable increase in the amount of reallocable resources flowing into primary school education. Research of a different kind would be needed to test this hypothesis. These results tell one nothing about the effects of a redistribution of resources within an authority between schools attended by children who are most likely to go on to higher education and other schools. They tell one little about the effects of increasing or diminishing the total amount of resources devoted to primary school education. I argue elsewhere that a small redistribution of resources in favour of authorities with bad social conditions would leave the pattern of student yield unaffected, and that such a redistribution would be more compatible with the aim to maximise the contribution of education to economic growth than is usually thought.†
B. VARIATION IN STANDARDS OF PROVISION AND SOCIAL CONDITIONS
6. The aim of this section is to describe the variation in standards of provision of primary school education and some other services enjoyed by children of primary school age, showing how each important aspect is correlated with social conditions which make it 'desirable' that services should be provided at a higher standard if one were to assume that the most important criterion for assessing the distribution of resources was the extent to which it accorded effective equality of educational opportunity. It is necessary to make some such assumption because the aims of some of the more important branches of the education service are many, some may conflict with one another, and the socio-economic attributes of local education authorities differ in relevance according to the aims considered most important.
7. The pattern of variation in standards provides some evidence about what groups of children receive resources, how area of residence influences children's opportunities, and how standards of provision in areas where a high proportion of children live in social conditions which reduce their educational opportunity compare with standards in other areas. Both the degree to which variations in standards accompany - are correlated with - variations in social conditions, and the relative inequality of standards are important. These two aspects must be considered together, since the assessments of a case in which there is a high degree of correlation between a standards index and social conditions can greatly depend on the degree of inequality of the standards index, and similarly a certain degree of inequality can have very different implications depending on the degree of correlation.
*These analyses will be described in the forthcoming Occasional Paper, which will also deal with the complicated and fascinating pattern of variations in standards of provision of secondary and other forms of education.
†The Social Needs and Resources in Local Services, Chapter 12.
[page 621]
Table 3
Intercorrelation of Indices of Social Conditions, 1965
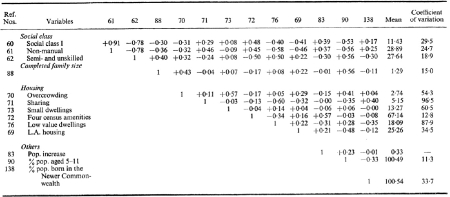 [click on the image for a larger version]
[page 622]
(i) Inter-Correlation of Social Conditions
8. Table 3 shows the degree of inter-correlation of indices of social conditions. The indices include measures of three of the five factors distinguished by HR Simpson in Table A of Appendix II of The Home and The School as having a major influence on the educational achievement of children of primary school age. In addition to indices of social class, bad housing, and family size, there are indices of population growth, of the proportion of the population of primary school age, and of the proportion of the population born in newer Commonwealth countries.* All of these measure factors which can create additional needs for educational resources or higher standards of provision. (The tables for education welfare services include other indices of social conditions.)
9. Table 3 shows that, as Moser found,† social class indices were correlated with other socio-economic indices. Low social class, overcrowding, the absence of housing amenities, low value dwellings, and a high proportion of the population of infant and primary school age, and to a lesser extent large families and declining populations are all correlated with each other and thus interact to create an environment that obstructs educational progress. The correlation coefficients seem high enough for it to be feasible to compile an index of bad social conditions which would provide a reasonably good measure of the degree to which LEAs suffer from social conditions detrimental to the educational attainment of their pupils.‡
(ii) Primary school provision and social conditions
10. Table 4 shows the correlations between indices of standards of provision of primary schools and those of social conditions. The degree of correlation of most standards indices with the social conditions indices was low. Standards were, on the whole, neither strongly positive nor negatively correlated with social conditions detrimental to the educational development of primary school pupils. Moreover, most important standards indices were less variable than were social conditions indices. There is therefore little indication that the central government and local authorities have created a system which ensures positive discrimination in favour of (or against) the educationally difficult areas.
11. Expenditure per pupil on debt charges, reflecting the proportion of school places built since 1945, was more unequally distributed than total expenditure or expenditure on teachers' salaries per pupil and debt charges tended to be lowest in low social class areas. This is largely a reflection of the concentration of the building effort on areas with rapidly expanding populations. Authorities with a high proportion of their labour force in semi-skilled and unskilled jobs tended to have a higher proportion of their quota unfilled than other authorities, but the degree of variation in the proportion of the quota unfilled was very small.
12. Teachers' salaries and total cost per pupil in 1950-1 were as weakly correlated with social conditions as they were more than a decade later. This is not surprising, since patterns of provision of local authority services show
*JWB DOUGLAS The Home and the School, London, 1964, Appendix II
†CA MOSER and W SCOTT British Towns, London. 1961.
‡Such an index will be presented and the extent to which it accounts for variation will be analysed in the forthcoming Occasional Paper. Op. cit.
[page 623]
Table 4
Correlation of Indices of Primary School Provision with Social Conditions
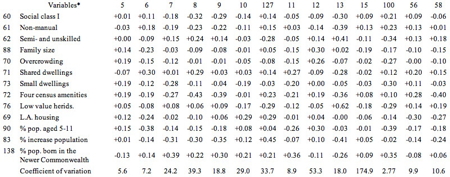 [click on the image for a larger version]
*Variable Key:
5. Pupils per full-time teacher, 1962.
6. Cost of teachers school wages and salaries per pupil, 1961-2.
7. Cost of non-teaching staff wages and salaries per pupil, 1961-2.
8. Cost of upkeep of buildings and grounds per pupil, 1961-2.
9. Cost of fuel, etc. per pupil, 1961-2.
10. Rent, rate and other expenses per pupil, 1961-2.
127. Debt charges per pupil, 1961-2.
11. Total cost per pupil, 1961-2, excluding nursery schools.
12. Percentage of classes which are oversize (more than 30) in Junior Schools, 1961.
13. Pupils per school, 1962.
15. Number of teachers released for special advanced courses per teacher, 1964.
100. Full-time equivalent teachers as a proportion of the quota recommended by the Ministry of Education, 1961.
56. Cost of teaching salaries per pupil, 1950-1
58. Total cost per pupil, 1950-1.
[page 624]
great continuity. This was as true of education as in general it was of local health, welfare and children services.* Table 5 shows the same pattern in primary education. One could predict over a third of the variation in teachers' salaries per pupil in 1961-2 from the pattern in 1950-1, and over four fifths of it from the pattern in 1958-9. Similarly, one could predict more than a quarter of the variation in total costs per pupil from the variation in 1950-1, and three quarters of it from the variation in 1958-9. This continuity of pattern was even more striking in the case of the 53 boroughs which Professor Moser classified as 'industrial'.† Among these the variation of teachers' salaries in 1950-1 accounted for one half of the variation in 1961-2, and the variation of total cost per pupil in 1950-1 accounted for 30 per cent of the variation in 1961-2. Thus patterns of expenditure on the principal items in the budget tend to persist over a long period.
Table 5
Continuity in Standards
| 1958-9 | 1961-2 | Coefficient
of variation |
| Teachers' salaries* |
| 1950-1 | +0.62 | +0.61 | 9.9 |
| 1958-9 | 1 | +0.90 | 7.9 |
| 1961-2 | | 1 | 7.2 |
| Total cost* |
| 1950-1 | +0.61 | +0.51 | 10.6 |
| 1958-9 | 1 | +0.85 | 8.8 |
| 1961-2 | | 1 | 8.9 |
*Per pupil.
13. A second feature of Table 5 is the decline in the relative inequality of the indices over time. The relative inequality of standards was slightly greater in the 83 county boroughs than in the industrial county boroughs alone, and the decline in inequality seemed to be greater. There was a similar decline in inequality of total costs per pupil up to 1958-9, but after that the tendency for inequality to decline among 83 boroughs seems to have been arrested, though the decline continued among industrial boroughs.
(iii) Education Welfare Services and Social Conditions
(a) School Meals and Milk
14. Most of the education welfare services analysed here have in common that they were provided mainly in order to assist poorer children to make more effective use of the education system. Therefore standards of provision should generally be highest where social conditions are worst. The services considered fell into five groups - school milk and meals, special education, the school medical services, nursery schools and recreation facilities. The correlation between standards of provision of school meals and milk services with social conditions indices are shown in Table 6. Variations in expenditure on meals and milk were dominated by variations in the former, the proportion receiving meals being negatively correlated (-0.26) with the proportion receiving milk.
*See BLEDDYN DAVIES Social Needs and Resources in Local Services, op. cit.
†CA MOSER and W SCOTT British Towns, op. cit.
[page 625]
The proportion receiving dinners was highest in the high social class areas where social conditions were good. It was also high where a high proportion of the working population were women.‡ The proportion receiving milk was correlated with bad social conditions. The contrast in patterns may well have been due to the fact that a charge is imposed for meals. Thus the proportion receiving dinners tended to be low where the proportion of children in great need was high. Therefore it is likely that schools meals are not being consumed by many of those who are in most need of them. Survey research is needed to investigate whether this is so.
(b) School Health Services
15. Table 7 shows that standards of provision of dental services were considerably more unequal than standards of provision of medical services, and that the number of dental officers was negatively correlated with low social class. Expenditure, which measures local authorities' financial effort to provide these services, was correlated with low social class, heavy industry, bad
Table 6
Correlations of Standards of Provision of School Meals and Milk Services with Social Conditions, 1961-1962
| Variables | Expend-
iture on
meals
and milk | % pupils
receiving
dinners | % pupils
receiving
milk | Food cost
per
dinner |
| | 43 | 45 | 46 | 47 |
| 60 | Social class I | -0.15 | +0.45 | -0.42 | -0.00 |
| 61 | Non-manual | -0.15 | +0.42 | -0.37 | +0.04 |
| 62 | Semi- and unskilled | +0.19 | -0.33 | +0.40 | -0.13 |
| 63 | Females:Males in employment | +0.07 | +0.40 | -0.06 | -0.41 |
| 70 | Overcrowding | +0.00 | -0.36 | +0.37 | -0.08 |
| 73 | Housing amenities | -0.08 | +0.15 | -0.13 | +0.11 |
| 74 | Rooms per dwelling | -0.21 | -0.01 | -0.06 | +0.16 |
| 76 | Low value dwellings | +0.35 | +0.07 | +0.18 | -0.21 |
| 88 | Family size | +0.03 | -0.34 | +0.37 | -0.02 |
| 89 | % women aged 35-39 widowed | -0.06 | -0.08 | +0.17 | -0.08 |
| 138 | % population born in Newer Commonwealth | -0.09 | +0.14 | -0.27 | +0.13 |
| 90 | % population aged 5-11 | +0.30 | -0.40 | +0.33 | +0.15 |
| 91 | % population aged 11-18 | +0.02 | -0.44 | +0.17 | +0.10 |
| Coefficient of variation | 17.1 | 24.7 | 5.3 | 3.8 |
[The following footnotes were printed below the above table, though no references to them appeared in the table itself - see notes to Table 7.]
*Per thousand population.
†Pupils in nursery, primary, secondary and special schools.
‡The correlation between low social class and women's working is very low, so that it would not be a statistical impossibility for the proportion receiving dinners to be positively correlated with both to a substantial degree.
[page 626]
housing, and population density, but the coefficients were low. In general, the standards of provision of school medical services were uncorrelated with indices of social conditions, as were the indices for primary schools.
(c) Nursery Schools, Special Education, Aid to Pupils in Secondary Schools, and Recreation Facilities
16. Many authorities did not provide nursery schools. It can be seen from Table 8 that the more extensive the provision of schools, the higher the pupil/teacher ratio. Thus the authorities providing nursery education on the largest scale may be using their staff most efficiently. Provision was uncorrelated with bad social conditions.*
17. Expenditure on special education was high in industrial towns and in bigger authorities. Expenditure on aid to secondary school pupils was uncorrelated with social conditions. Although expenditure on recreation facilities was high in densely populated areas, it was uncorrelated with other social conditions indices.
(d) Inequality of Standards of Provision of Education Welfare Services
18. Indices of standards of provision of these education welfare services were much more unequally distributed than the most important indices of standards of provision of primary and secondary education. This can be attributed partly to the fact that the authorities and those using the services both have greater scope for choice in the provision and use of welfare services than in the provision and use of education itself.
(iv) Related Services, Education Welfare Services and Social Conditions
19. As Table 9 shows, provision of day nurseries was uncorrelated (-0.11) with the provision of nursery school places, but was markedly correlated with the ratio of women to men in employment, population size and the proportion of live births illegitimate. There were lower positive correlations with population density and the proportion of the population born in the newer Commonwealth countries. Expenditure on child welfare services by health departments correlated with standards of provision of most education welfare services, particularly expenditure on school medical services. Standards tended to be high in areas where populations had been falling, where a high proportion of adult males were in manual jobs, and where housing conditions were poor, but the correlations coefficients were low.
20. Expenditure on health visiting - less unequally distributed than the other related services by health departments - tended to be positively correlated with expenditure on medical services. Standards were correlated with the proportion of women aged 35-9 widowed, overcrowded housing, falling populations and low social class. The number of child care officers was correlated with the proportion of women working and with need correlates such as the proportion of live births illegitimate and the proportion of the population aged between 5 and 11 and the proportion of the population born in the newer Commonwealth countries. The number was, however, negatively correlated with low social class. The proportion of officers trained was also correlated with the illegitimate birth rate and the proportion of the population of school age. The
*An analysis of variance of the towns which provided a service also showed an absence of correlation with indices of social conditions.
[page 627]
Table 7
Correlation of Standards of Provision of School Health Services with Social Conditions Indices, 1961-1962
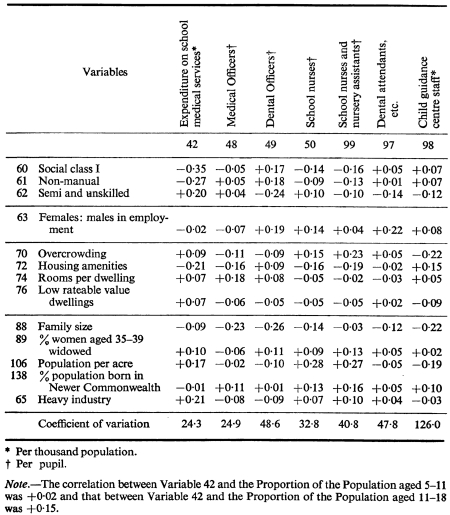 [click on the image for a larger version]
[page 628]
Table 8
Correlations of Standards of Provision of Nursery School Education, Special Education, Aid to Secondary School Pupils and Recreation Facilities with Social Conditions Indices, 1961-1962
| Variables | Nursery
schools
pupils* | Expend-
iture on
special
education* | Expend-
iture on
aid to
secondary
school
pupils
†* | Expend-
iture on
recrea-
tional
facilities* |
| | 1 | 40 | 112 | 41 |
| 60 | Social class I | -0.10 | -0.34 | +0.06 | -0.12 |
| 61 | Non-manual class | -0.19 | -0.33 | +0.13 | -0.10 |
| 62 | Semi and unskilled class | +0.13 | +0.13 | -0.00 | +0.04 |
| 63 | Employed females: employed males | +0.17 | +0.13 | +0.30 | -0.03 |
| 67 | Industrial occupations | +0.22 | +0.36 | -0.17 | -0.08 |
| 70 | Overcrowding | -0.04 | +0.29 | -0.19 | +0.18 |
| 72 | Housing amenities | -0.14 | -0.10 | +0.13 | -0.15 |
| 74 | Rooms per dwelling | -0.19 | -0.17 | -0.02 | +0.00 |
| 76 | Low rateable value dwellings | +0.26 | +0.16 | +0.04 | -0.04 |
| 88 | Family size | +0.04 | +0.17 | -0.02 | +0.04 |
| 89 | % women aged 35-39 widowed | -0.13 | -0.04 | +0.01 | -0.05 |
| 106 | Population per acre | -0.08 | +0.21 | -0.05 | +0.22 |
| 87 | % births illegitimate | -0.02 | +0.11 | -0.16 | +0.11 |
| 85 | Birth rate | +0.03 | +0.42 | -0.13 | +0.15 |
| 84 | % increase in population due to
other than births and deaths | -0.12 | -0.30 | +0.13 | -0.17 |
| 90 | % population aged 5-11 | +0.04 | +0.23 | -0.10 | +0.06 |
| 91 | % population aged 11-18 | -0.06 | +0.23 | -0.24 | +0.18 |
| 107 | Population size (log transformed) | -0.08 | +0.31 | -0.05 | +0.16 |
| 138 | % population born in
Newer Commonwealth | -0.18 | +0.27 | -0.20 | +0.26 |
| Coefficient of variation | 135.8 | 31.0 | 135.0 | 49.3 |
*Per thousand population.
†Per pupil.
[page 629]
Table 9
Correlations of Standards of Provision of Related Social Services with Education Welfare Services and Social Conditions, 1961-1962
| Variables | Expend-
iture on
NHS day
nurseries* | Expend-
iture on
NHS child
welfare
services* | Expend-
iture on
health
visiting* | No. of
child care
officers | % child care
officers
fully
trained |
| | 1 | 2 | 3 | 4 | 5 |
| (a) Related services and education welfare services |
| 1 | Nursery school pupils* | -0.11 | +0.20 | +0.09 | +0.13 | +0.17 |
| 40 | Expenditure on Special Education* | +0.34 | +0.28 | +0.04 | +0.03 | +0.09 |
| 41 | Expenditure on recreation facilities* | +0.03 | +0.13 | +0.09 | +0.09 | +0.04 |
| 42 | Expenditure on medical inspection* | +0.07 | +0.41 | +0.24 | -0.05 | +0.06 |
| 43 | Expenditure on meals and milk* | +0.23 | +0.22 | +0.08 | -0.15 | +0.02 |
| 112 | Expenditure on aid to pupils in secondary schools† | +0.01 | -0.18 | -0.17 | -0.05 | -0.04 |
| (b) Related Services and social conditions |
| 60 | Social class I | -0.09 | -0.34 | -0.11 | +0.25 | +0.13 |
| 61 | Non-manual class | -0.10 | -0.29 | -0.11 | +0.22 | +0.02 |
| 62 | Semi and unskilled class | +0.06 | +0.23 | +0.21 | -0.18 | -0.15 |
| 63 | Employed females:employed males | +0.41 | +0.06 | -0.04 | +0.33 | -0.12 |
| 70 | Overcrowding | +0.13 | +0.16 | +0.29 | -0.12 | -0.05 |
| 72 | Housing amenities | -0.16 | -0.22 | -0.07 | -0.02 | +0.21 |
| 74 | Rooms per dwelling | -0.19 | -0.13 | -0.04 | +0.14 | +0.00 |
| 76 | % dwellings of low value | +0.13 | +0.12 | +0.08 | -0.02 | +0.01 |
| 88 | Family size | -0.02 | -0.09 | +0.19 | -0.06 | -0.07 |
| 89 | Women aged 35-39 widowed | +0.01 | -0.04 | +0.35 | -0.03 | -0.05 |
| 87 | % births illegitimate | +0.31. | +0.13 | +0.05 | +0.29 | +0.25 |
| 85 | Birth rate | +0.19 | +0.17 | +0.19 | -0.21 | -0.13 |
| 84 | % increase in population due to
other than births and deaths | -0.25 | -0.29 | -0.23 | +0.03 | +0.13 |
| 90 | % population aged 5-11 | -0.01 | +0.14 | +0.19 | -0.30 | -0.25 |
| 91 | % population aged 11-18 | +0.05 | +0.23 | +0.03 | -0.11 | -0.28 |
| 107 | Population size (log transformed) | +0.41 | +0.12 | +0.22 | +0.16 | +0.25 |
| 138 | % population born in
Newer Commonwealth | +0.23 | +0.15 | -0.03 | +0.22 | +0.18 |
| Coefficient of variation | 95.3 | 40.7 | 32.8 | 43.8 | 87.6 |
*Per thousand population.
†Per population under 18.
[page 630]
proportion of child care officer establishment filled was less correlated with social conditions. Thus standards of provision of these related health and children's services were not more strongly correlated with bad social conditions than were education welfare services, and standards of provision of the two sets of services were in general uncorrelated.
The distribution of educational resources is not highly correlated with social conditions which generate needs for them, and the same is true for other social services for children.
[page 631]
EDUCATION CORRELATION MATRICES
LIST OF VARIABLES
Nursery
1. Number or pupils on nursery school registers per thousand population, 1962.
Primary
5. Pupils per full-time teacher in primary school, 1962.
6. Cost of primary school teachers' wages and salaries per pupil, 1961-2.
7. Cost of non-teaching staff wages and salaries per pupil, 1961-2.
8. Cost of upkeep of buildings and grounds per pupil, 1961-2.
9. Cost of fuel, light, cleaning materials and water per pupil, 1961-2.
10. Rent, rates and other expenses per pupil, 1961-2.
11. Total cost per primary school (excluding nursery) pupil, 1961-2.
12. Percentage of classes which are oversize (more than 30) in junior schools, 1961.
13. Average number of pupils per primary school maintained by local education authorities, 1962.
15. Number of teachers released from maintained primary schools and establishments for special advanced courses per ten thousand teachers, 1964.
Secondary
20. Cost of secondary school teachers' wages and salaries per pupil, 1961-2.
21. Cost of non-teaching staff wages and salaries per pupil, 1961-2.
22. Cost of upkeep of building and grounds per pupil, 1961-2.
23. Cost of fuel, light, cleaning materials and water per pupil, 1961-2.
24. Rent, rates, and other expenses per pupil, 1961-2.
28. Total cost secondary education per pupil, 1961-2.
30. Percentage of classes which are oversize (more than 30) in senior schools, 1961.
32. Teachers released from maintained secondary schools and establishments for special advanced courses per ten thousand teachers, 1964.
Student Yield
37. Full value local education authority awards tenable 1961-2 at non-university institutions per thousand population, average of three age groups (17, 18, 19),1961.
38. Lesser value local education authority awards tenable 1961-2 at non-university institutions per thousand population, average of three age groups (17, 18, 19), 1961.
39. Students entering teachers' training colleges per thousand population, average of three age groups (17,18,19),1961.
Other
40. Net expenditure on special schools per thousand population, 1961-2.
41. Net expenditure for facilities for recreation, etc., per thousand population, 1961-2,
42. Net expenditure on medical inspection and treatment per thousand population, 1961-2.
43. Net expenditure on provision of milk and meals per thousand population, 1961-2.
[page 632]
45. Proportion of pupils (nursery, primary, secondary, special) receiving dinners (day pupils only), 1961.
46. Proportion of pupils (nursery, primary, secondary, special) receiving milk (day pupils and boarders), 1961.
47. Cost of food per dinner, 1961-2.
48. Medical officers per ten thousand pupils, 1961.
49. Dental officers per ten thousand pupils, 1961.
50. School nurses per ten thousand pupils, 1961.
55. Pupils aged 17 as a proportion of those aged 13 four years before, 1962.
56. Cost of salaries of primary teachers per pupil, 1950-1.
57. Cost of salaries of primary teachers per pupil, 1958-9.
58. Total cost of primary (excluding nursery) education per pupil, 1950-1.
Occupation and Socio-Economic Class
60. Males in administrative, managerial and professional occupations as a proportion of economically active males, 1961.
61. Males in non-manual occupations as a proportion of economically active males, 1961.
62. Males in semi or unskilled occupations as a proportion of economically active males, 1961.
63. Economically active females as a proportion of economically active males, 1961.
65. Males employed in heavy industry occupations as a proportion of occupied males, 1961.
66. Males employed in light industry occupations as a proportion of occupied males, 1961.
67. Males employed in industry as a proportion of occupied males, 1961.
Housing
69. Proportion of private households rented from a local authority or New Town Corporation, 1961.
70. Proportion of private households living at more than 1½ persons per room, 1961.
71. Number of private households sharing a dwelling as a proportion of all private households, 1961.
72. Proportion of private households with exclusive use of four census amenities (hot and cold tap water, fixed bath and WC), 1961.
73. Proportion of dwellings with one to three rooms, 1961.
74. Rooms per dwelling, 1961.
76. Proportion of domestic hereditaments with rateable value under £10 after the 1954 revaluation.
Demographic
83. Per cent change in population, 1951-61.
84. Per cent change in population due to causes other than births and deaths, 1951-61.
85. Crude birth rate, average for 1960-2.
87. Illegitimate births as a proportion of live births, average for 1960-2.
88. Family size: children aged 0-14 as a proportion of all married women aged 25-54, 1961.
89. Proportion of women aged 35-39 who are widowed, 1961.
90. Population aged 5-11 per thousand population, 1961.
91. Population aged 12-18 per thousand population, 1961.
[page 633]
Miscellaneous
97. Dental attendant, etc. in full-time equivalents (1960) per ten thousand pupils, 1961.
98. Staff of child guidance centres, in full-time equivalents (1960) per ten thousand pupils, 1961.
99. Nurses and nursing assistants in full-time equivalents (1960) per ten thousand pupils, 1961.
100. Number of teachers in full-time equivalents as a proportion of the quota recommended by Department of Education, 1959-61.
106. Population per acre, 1961.
107. Population size (log transformed), 1961.
108. Total number of new awards to universities per thousand population 17-19 average for 1960-2.
109. Total number of new awards (universities, plus non-universities) and training college entrants per thousand population aged 17-19 average for 1960-2.
112. Aid to pupils in secondary schools per thousand secondary school pupils, 1962.
117. Proportion of 13 year olds in grammar and comprehensive, direct grant and independent schools, 1961.
127. Cost of debt charges per primary school pupil, 1961-2.
128. Cost of debt charges per secondary school pupil, 1961-2.
129. Net expenditure on day nurseries (provided under National Health Service Act) per thousand population, 1962-3.
130. Net expenditure on child welfare services (provided under National Health Service Act) per thousand population, 1962-3.
131. Net expenditure on health visiting (provided under National Health Service Act) per thousand population, 1962-3.
135. Total number of child care officers per thousand population under 18, 1965.
136. Proportion of child care officers fully trained, 1965.
138. Number of persons born in Commonwealth countries (less Canada, Australia, New Zealand and South Africa) per thousand population, 1961.